
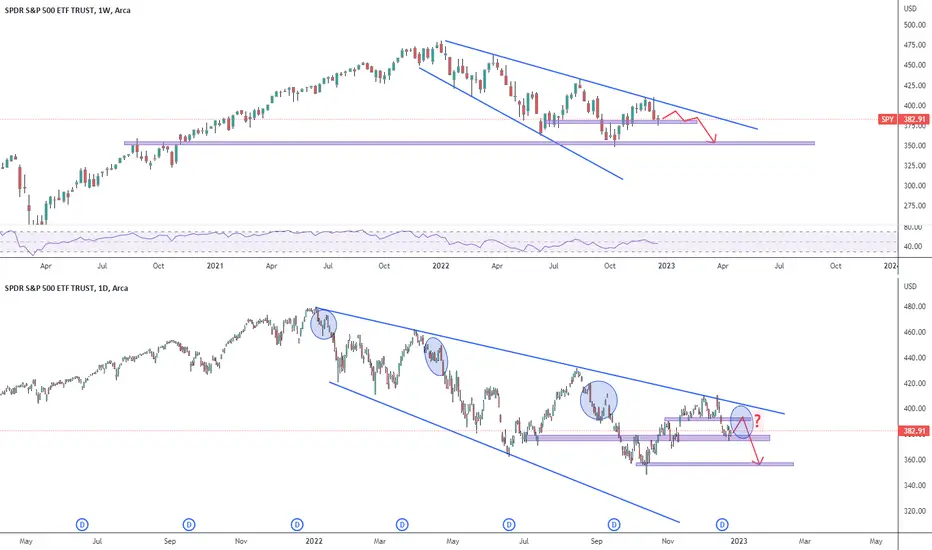
Top chart weekly timeframe, bottom chart daily timeframe. Price action on the top chart shows a Long Legged Doji candle at the $380 important support level. I think we will see a short term rally, retest the previous support now resistance $390 and then crash to the downside. I'm just waiting for the retest to open a short position.

Penafian
Maklumat dan penerbitan adalah tidak bertujuan, dan tidak membentuk, nasihat atau cadangan kewangan, pelaburan, dagangan atau jenis lain yang diberikan atau disahkan oleh TradingView. Baca lebih dalam Terma Penggunaan.
Penafian
Maklumat dan penerbitan adalah tidak bertujuan, dan tidak membentuk, nasihat atau cadangan kewangan, pelaburan, dagangan atau jenis lain yang diberikan atau disahkan oleh TradingView. Baca lebih dalam Terma Penggunaan.