
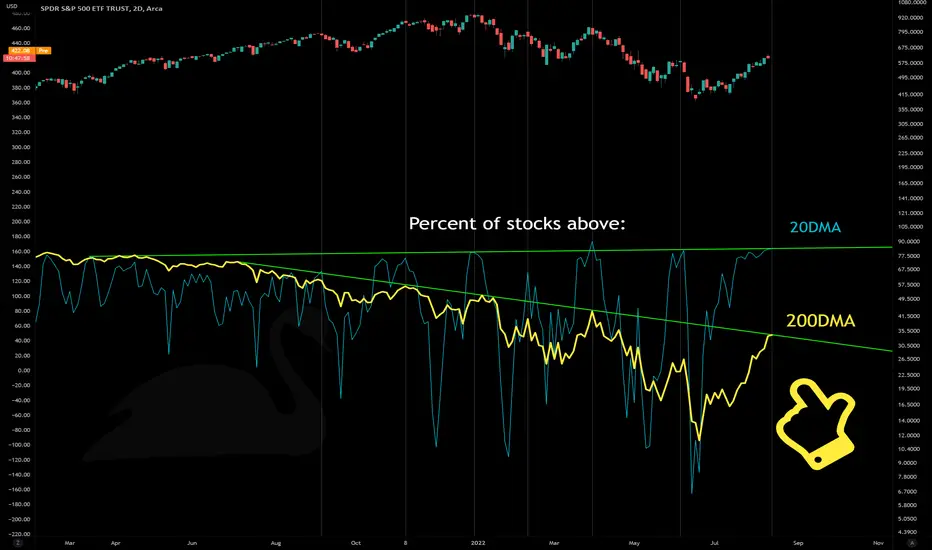
Chart shows SPY (2D) and the percentage of stocks above their 20DMA(aqua) and 200DMA (yellow).
Each series is the mean percentage of 7 index's which, in turn, aggregate several thousand underlying stocks. The 7 indexes: S&P, Dow, Nasdaq, Russell, TSX, NYSE, AMEX
The peaks of the index coincide with market tops (as shown in the chart). Based on this pattern it's reasonable to forecast a top. Like the weather forecast, the timing is uncertain, the underlying averages lag, and their are plenty of false positives**.
Current forecast is for rain.
** Why do we listen to a weather forecast that we know is somewhat inaccurate? Because it's useful in answering questions like: "should i take an umbrella with me today?" **
All models (and indicators) are meant as useful approximations of reality.
Each series is the mean percentage of 7 index's which, in turn, aggregate several thousand underlying stocks. The 7 indexes: S&P, Dow, Nasdaq, Russell, TSX, NYSE, AMEX
The peaks of the index coincide with market tops (as shown in the chart). Based on this pattern it's reasonable to forecast a top. Like the weather forecast, the timing is uncertain, the underlying averages lag, and their are plenty of false positives**.
Current forecast is for rain.
** Why do we listen to a weather forecast that we know is somewhat inaccurate? Because it's useful in answering questions like: "should i take an umbrella with me today?" **
All models (and indicators) are meant as useful approximations of reality.

Penafian
Maklumat dan penerbitan adalah tidak bertujuan, dan tidak membentuk, nasihat atau cadangan kewangan, pelaburan, dagangan atau jenis lain yang diberikan atau disahkan oleh TradingView. Baca lebih dalam Terma Penggunaan.
Penafian
Maklumat dan penerbitan adalah tidak bertujuan, dan tidak membentuk, nasihat atau cadangan kewangan, pelaburan, dagangan atau jenis lain yang diberikan atau disahkan oleh TradingView. Baca lebih dalam Terma Penggunaan.