
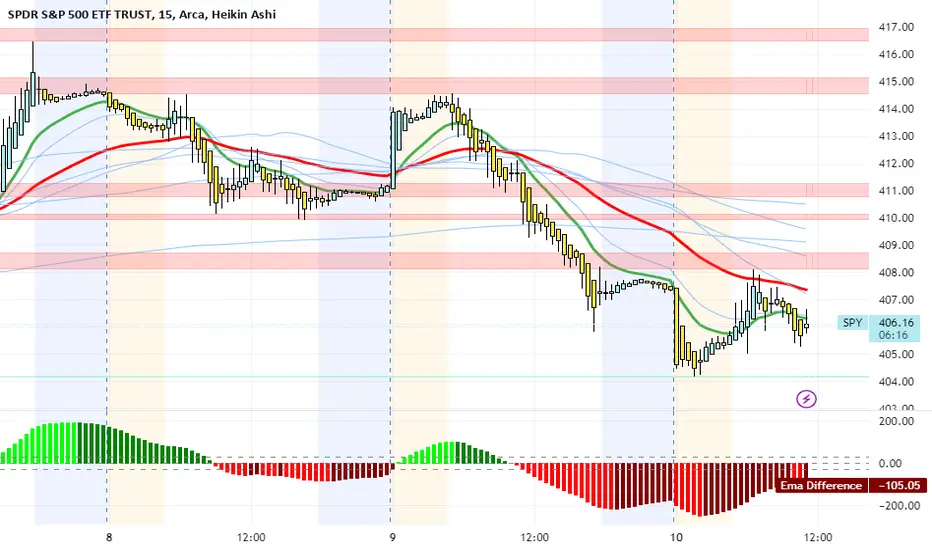
Simple to use on the 15 minute to Daily chart. When the Emas cross with green on the top buy calls within $2 strike. When cross with red on the top buy puts within $2 strike. Bottom Mac'd Ema difference should also be same color as top Ema. Green/Green or Red/Red. Any light blue line Ema or Sma can be support or resistance so be prepared to sell. Buy time never buy contracts that expire that day. Greeks will burn you. Support and resistance are the green and red stripes across the chart(also sell or buy points. Ideally enter on the 5 minute chart then switch to the 15 minute or half hour chart to eliminate noise. Happy trading.

Penafian
Maklumat dan penerbitan adalah tidak bertujuan, dan tidak membentuk, nasihat atau cadangan kewangan, pelaburan, dagangan atau jenis lain yang diberikan atau disahkan oleh TradingView. Baca lebih dalam Terma Penggunaan.
Penafian
Maklumat dan penerbitan adalah tidak bertujuan, dan tidak membentuk, nasihat atau cadangan kewangan, pelaburan, dagangan atau jenis lain yang diberikan atau disahkan oleh TradingView. Baca lebih dalam Terma Penggunaan.