
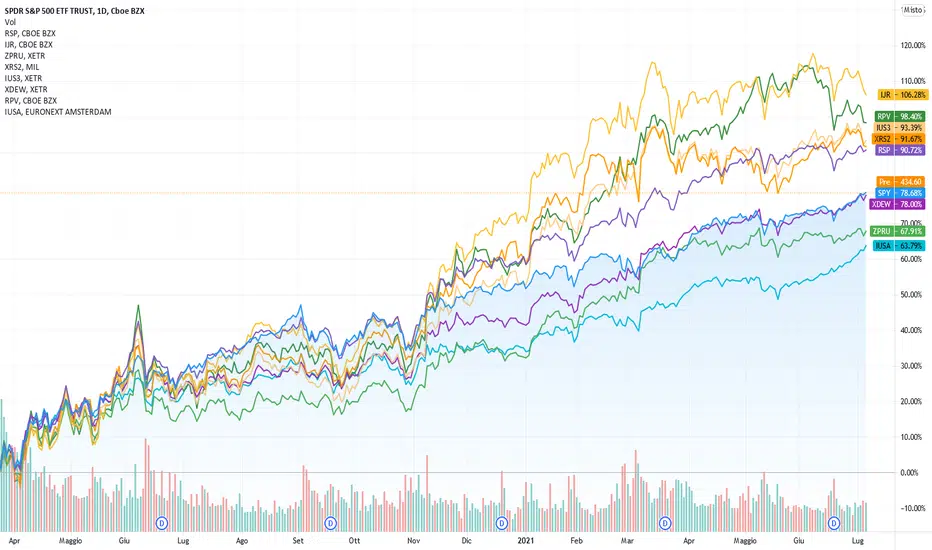
This image shows the performance of different ETF strategies after a market crash. For each strategy the chart shows a US listed ETF (first one) and one or more EU listed ETFs (all the following ones), this because the EUR/USD exchange creates a difference in the US and EU ETFs performance.
- bluish - S&P 500 baseline ( SPY / IUSA )
- purpleish - S&P 500 Equal Weight strategy ( RSP / XDEW )
- yellowish - SmallCap strategy - S&P Smallcap 600 and Russell 2000 ( IJR / IUS3 / XRS2 )
- greenish - S&P 500 Value strategy ( RPV / ZPRU )
The three strategies, Equal Weight, SmallCap and Value, all beated the baseline S&P 500.
- bluish - S&P 500 baseline ( SPY / IUSA )
- purpleish - S&P 500 Equal Weight strategy ( RSP / XDEW )
- yellowish - SmallCap strategy - S&P Smallcap 600 and Russell 2000 ( IJR / IUS3 / XRS2 )
- greenish - S&P 500 Value strategy ( RPV / ZPRU )
The three strategies, Equal Weight, SmallCap and Value, all beated the baseline S&P 500.

Penafian
Maklumat dan penerbitan adalah tidak bertujuan, dan tidak membentuk, nasihat atau cadangan kewangan, pelaburan, dagangan atau jenis lain yang diberikan atau disahkan oleh TradingView. Baca lebih dalam Terma Penggunaan.
Penafian
Maklumat dan penerbitan adalah tidak bertujuan, dan tidak membentuk, nasihat atau cadangan kewangan, pelaburan, dagangan atau jenis lain yang diberikan atau disahkan oleh TradingView. Baca lebih dalam Terma Penggunaan.