 Swarnsarita Jewels India LimitedTelah dikemas kini
SWARNSAR Strong Resistance Breakout with Massive Volume
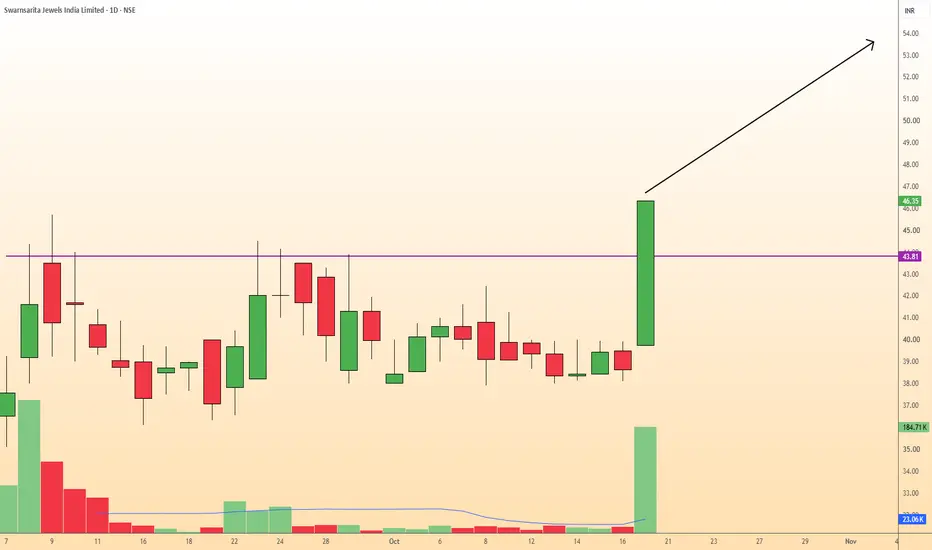
The daily chart of Swarnsarita Jewels India Limited indicates a decisive bullish breakout above a major resistance zone.
For several weeks, the price consolidated and faced consistent rejection near the 43.80 - 44.00 mark, which is marked by the purple horizontal line.
In the most recent session, the stock shattered this resistance with a massive, full-bodied bullish candle, closing at 46.35 (+19.98%).
The most compelling aspect of this setup is the volume confirmation. The breakout occurred on exceptionally high volume (184.71K), towering over the average volume line (23.06K).
This indicates strong institutional or widespread buyer interest backing the move.
Trade Plan:
Entry Point: Current Market Price (46.35) for aggressive entries, or a safer entry on a potential retest of the breakout level around 44.00 - 45.00.
Target: 52.00 - 54.00. This is calculated by projecting the depth of the previous consolidation range (roughly 37.00 to 44.00) upward from the breakout point.
Stop Loss: Daily close below 39.50. Placing the stop loss just below the low of the breakout candle (39.75) ensures that if the price falls back into the previous consolidation zone, the breakout is invalidated and the risk is managed.
For several weeks, the price consolidated and faced consistent rejection near the 43.80 - 44.00 mark, which is marked by the purple horizontal line.
In the most recent session, the stock shattered this resistance with a massive, full-bodied bullish candle, closing at 46.35 (+19.98%).
The most compelling aspect of this setup is the volume confirmation. The breakout occurred on exceptionally high volume (184.71K), towering over the average volume line (23.06K).
This indicates strong institutional or widespread buyer interest backing the move.
Trade Plan:
Entry Point: Current Market Price (46.35) for aggressive entries, or a safer entry on a potential retest of the breakout level around 44.00 - 45.00.
Target: 52.00 - 54.00. This is calculated by projecting the depth of the previous consolidation range (roughly 37.00 to 44.00) upward from the breakout point.
Stop Loss: Daily close below 39.50. Placing the stop loss just below the low of the breakout candle (39.75) ensures that if the price falls back into the previous consolidation zone, the breakout is invalidated and the risk is managed.
Dagangan ditutup: sasaran tercapai
Target was already achieved.
Penafian
Maklumat dan penerbitan adalah tidak bertujuan, dan tidak membentuk, nasihat atau cadangan kewangan, pelaburan, dagangan atau jenis lain yang diberikan atau disahkan oleh TradingView. Baca lebih dalam Terma Penggunaan.
Penafian
Maklumat dan penerbitan adalah tidak bertujuan, dan tidak membentuk, nasihat atau cadangan kewangan, pelaburan, dagangan atau jenis lain yang diberikan atau disahkan oleh TradingView. Baca lebih dalam Terma Penggunaan.