
📉 Elliott Wave Analysis | 4-Hour Chart
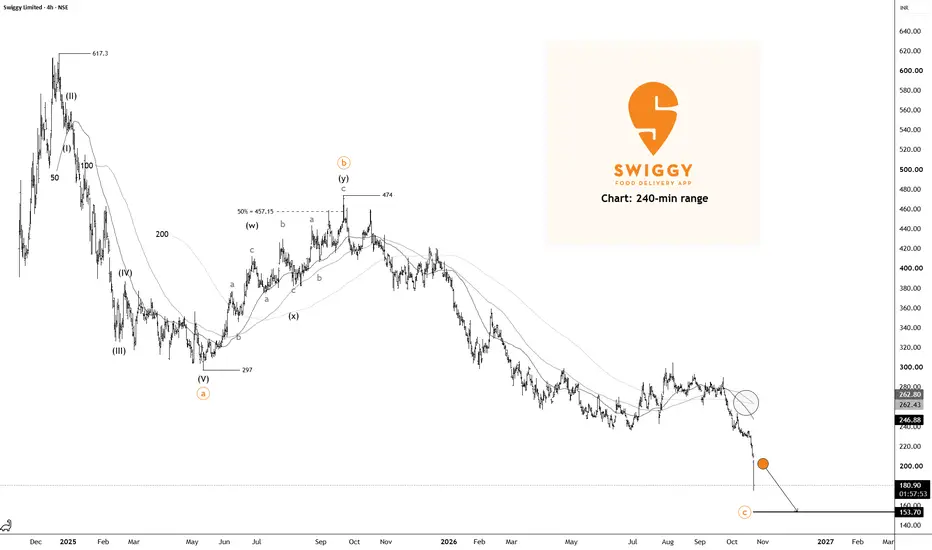
Swiggy has witnessed a sharp bearish breakdown, with price falling to 176.65 on the 4-hour chart. The current technical structure favors a bearish interpretation, with the possibility that the decline from 474 is part of a larger corrective sequence.
The decline from 617.30 to 297 appears to have developed into a five-wave bearish impulse, labeled Waves (I) through (V). Following this decline, Swiggy recovered toward 474 in a complex W–X–Y corrective structure. The subsequent sell-off suggests that the broader bearish trend may have resumed.
🎯 Downside Targets to Watch
💬 Will Swiggy reach all three downside targets, or could a recovery begin first? Share your view in the comments!
This analysis is based on Elliott Wave interpretation of the 4-hour chart and is for educational purposes only. It is not financial advice.
Swiggy has witnessed a sharp bearish breakdown, with price falling to 176.65 on the 4-hour chart. The current technical structure favors a bearish interpretation, with the possibility that the decline from 474 is part of a larger corrective sequence.
The decline from 617.30 to 297 appears to have developed into a five-wave bearish impulse, labeled Waves (I) through (V). Following this decline, Swiggy recovered toward 474 in a complex W–X–Y corrective structure. The subsequent sell-off suggests that the broader bearish trend may have resumed.
🎯 Downside Targets to Watch
- Target: 170
- Target: 166
- Target: 154
💬 Will Swiggy reach all three downside targets, or could a recovery begin first? Share your view in the comments!
This analysis is based on Elliott Wave interpretation of the 4-hour chart and is for educational purposes only. It is not financial advice.

Penerbitan berkaitan
Penafian
Maklumat dan penerbitan adalah tidak bertujuan, dan tidak membentuk, nasihat atau cadangan kewangan, pelaburan, dagangan atau jenis lain yang diberikan atau disahkan oleh TradingView. Baca lebih dalam Terma Penggunaan.
Penerbitan berkaitan
Penafian
Maklumat dan penerbitan adalah tidak bertujuan, dan tidak membentuk, nasihat atau cadangan kewangan, pelaburan, dagangan atau jenis lain yang diberikan atau disahkan oleh TradingView. Baca lebih dalam Terma Penggunaan.