
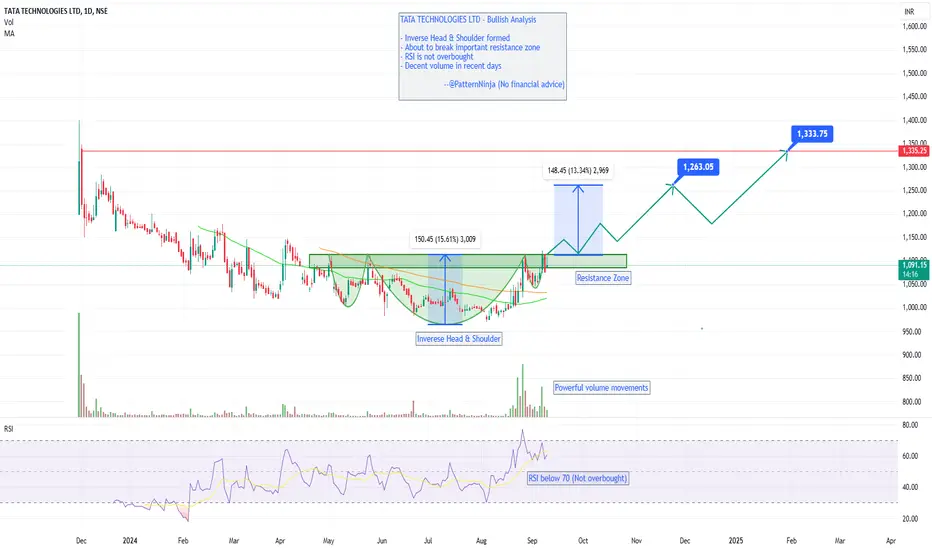
Bullish Analysis of TATA TECHNOLOGIES LTD
Key Observations:
1. Pattern Identified: Inverse Head & Shoulders
- The inverse head and shoulders pattern suggests a bullish reversal.
2. Resistance Zone:
- The stock is approaching a key resistance zone.
- A breakout above this zone could signal a strong upward movement.
3. Target Projections:
- If the breakout happens, the first target is set at ₹1,263, followed by ₹1,333.
4. Volume:
- Recent volume spikes indicate strong buying interest, supporting the potential breakout.
5. RSI:
- Currently at 60.91, it indicates strength, but still below the overbought zone, allowing room for upward movement.
Conclusion:
- Entry Point: A breakout above ₹1,093 can be a bullish signal.
- Targets: ₹1,263, ₹1,333.
- Risk: Watch for failure to break the resistance zone, which may signal a short-term pullback.
Follow us for STOP-LOSS updates.
Note: Always consider risk management and market conditions before making investment decisions.
Key Observations:
1. Pattern Identified: Inverse Head & Shoulders
- The inverse head and shoulders pattern suggests a bullish reversal.
2. Resistance Zone:
- The stock is approaching a key resistance zone.
- A breakout above this zone could signal a strong upward movement.
3. Target Projections:
- If the breakout happens, the first target is set at ₹1,263, followed by ₹1,333.
4. Volume:
- Recent volume spikes indicate strong buying interest, supporting the potential breakout.
5. RSI:
- Currently at 60.91, it indicates strength, but still below the overbought zone, allowing room for upward movement.
Conclusion:
- Entry Point: A breakout above ₹1,093 can be a bullish signal.
- Targets: ₹1,263, ₹1,333.
- Risk: Watch for failure to break the resistance zone, which may signal a short-term pullback.
Follow us for STOP-LOSS updates.
Note: Always consider risk management and market conditions before making investment decisions.

Penerbitan berkaitan
Penafian
Maklumat dan penerbitan adalah tidak bertujuan, dan tidak membentuk, nasihat atau cadangan kewangan, pelaburan, dagangan atau jenis lain yang diberikan atau disahkan oleh TradingView. Baca lebih dalam Terma Penggunaan.
Penerbitan berkaitan
Penafian
Maklumat dan penerbitan adalah tidak bertujuan, dan tidak membentuk, nasihat atau cadangan kewangan, pelaburan, dagangan atau jenis lain yang diberikan atau disahkan oleh TradingView. Baca lebih dalam Terma Penggunaan.