
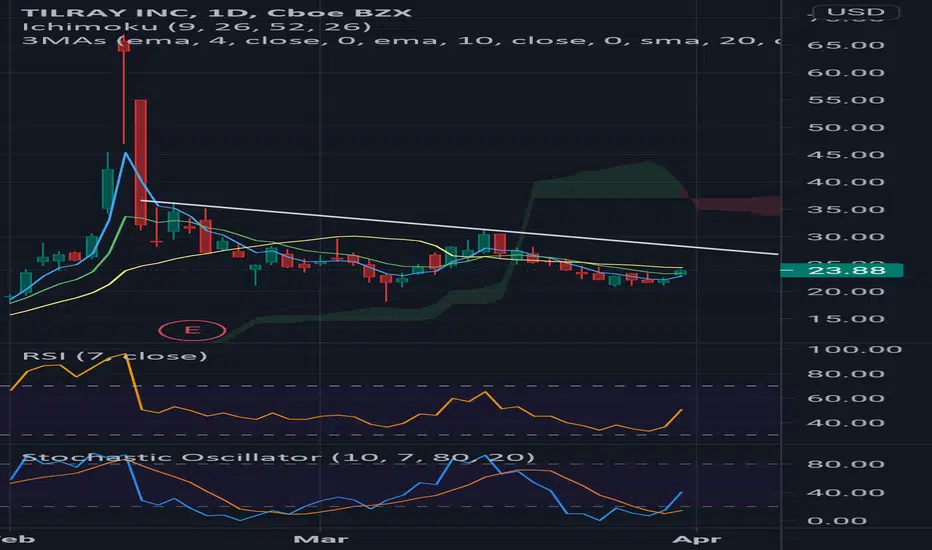
The chart is simple to read with RSI and stochastic both turning up. You can trade up to the blue line, even a day trade. Hold for break higher or reenter after line is broken, since there could be a pullback first or line may hold. For a longer hold I want to see moving averages cross up.
Risk is low because stops can be a certain price and/or a percentage of option loss. It depends on your trade. For example near today's open I bought weekly 24 calls for 50cents. I can use 22.99 and 22.80 as stops, and I can also exit if option goes below 0.40. These are initial stops that I may adjust as trade works.
Risk is low because stops can be a certain price and/or a percentage of option loss. It depends on your trade. For example near today's open I bought weekly 24 calls for 50cents. I can use 22.99 and 22.80 as stops, and I can also exit if option goes below 0.40. These are initial stops that I may adjust as trade works.

Penafian
Maklumat dan penerbitan adalah tidak bertujuan, dan tidak membentuk, nasihat atau cadangan kewangan, pelaburan, dagangan atau jenis lain yang diberikan atau disahkan oleh TradingView. Baca lebih dalam Terma Penggunaan.
Penafian
Maklumat dan penerbitan adalah tidak bertujuan, dan tidak membentuk, nasihat atau cadangan kewangan, pelaburan, dagangan atau jenis lain yang diberikan atau disahkan oleh TradingView. Baca lebih dalam Terma Penggunaan.