Panjang
TNY update.
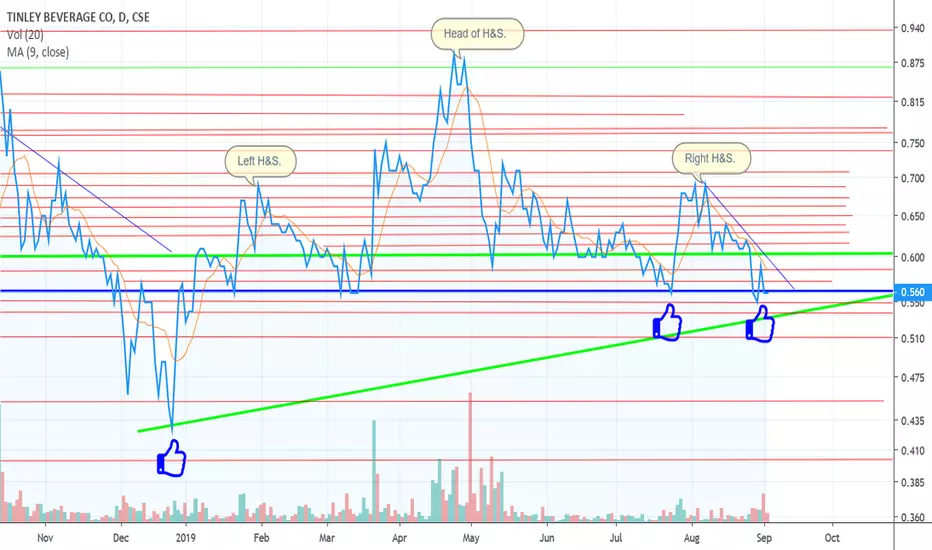
So, since the last time I posted a chart on TNY we were trading in descending triangle that broke to the downside on a "short term time frame." I had mentioned that the pattern could also be a bull flag, but that was not the case.
It is interesting however to see Tinley get back up to the 56c level where there seems to be historic support dating back to Aug 2018.
I can speculate all I want about where the share price may be in the future, but only time will tell per usual.
It is interesting however to see Tinley get back up to the 56c level where there seems to be historic support dating back to Aug 2018.
I can speculate all I want about where the share price may be in the future, but only time will tell per usual.

Penerbitan berkaitan
Penafian
Maklumat dan penerbitan adalah tidak bertujuan, dan tidak membentuk, nasihat atau cadangan kewangan, pelaburan, dagangan atau jenis lain yang diberikan atau disahkan oleh TradingView. Baca lebih dalam Terma Penggunaan.
Penerbitan berkaitan
Penafian
Maklumat dan penerbitan adalah tidak bertujuan, dan tidak membentuk, nasihat atau cadangan kewangan, pelaburan, dagangan atau jenis lain yang diberikan atau disahkan oleh TradingView. Baca lebih dalam Terma Penggunaan.