
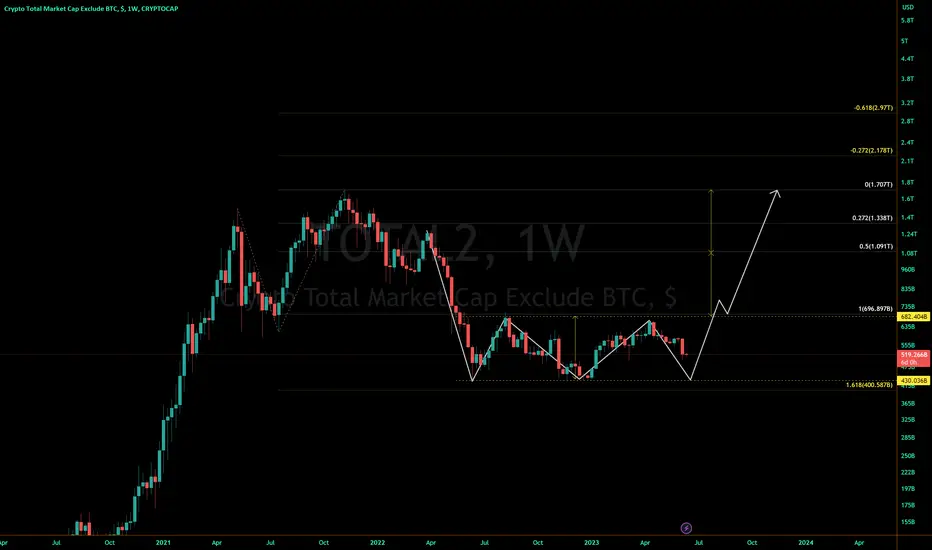
Total2 looks like an expanded flat completing its reversal at the end of a C wave.
It has twice bottomed just shy of the 1.618 for its trend-based fib, and may or may not reach a 3rd bottom near this area before exiting above its neckline.
If it doesn't reach bottom again, it's possible it could perform a move similar to what BTCUSD did here:

However, it has so far failed to maintain a breakout if we draw a similar wedge on Total2:

A 1x measured target lines up with its 50% trend-based fib, while the 2x measured target for the triple-bottom lines up exactly with its 0% fib, exactly where total2 reached its ATH.
This would go in line with my theory that movements in DXY could lead to recoveries across multiple markets that end in double-tops.
It has twice bottomed just shy of the 1.618 for its trend-based fib, and may or may not reach a 3rd bottom near this area before exiting above its neckline.
If it doesn't reach bottom again, it's possible it could perform a move similar to what
BTCUSD did here:However, it has so far failed to maintain a breakout if we draw a similar wedge on Total2:
A 1x measured target lines up with its 50% trend-based fib, while the 2x measured target for the triple-bottom lines up exactly with its 0% fib, exactly where total2 reached its ATH.
This would go in line with my theory that movements in DXY could lead to recoveries across multiple markets that end in double-tops.

Penafian
Maklumat dan penerbitan adalah tidak bertujuan, dan tidak membentuk, nasihat atau cadangan kewangan, pelaburan, dagangan atau jenis lain yang diberikan atau disahkan oleh TradingView. Baca lebih dalam Terma Penggunaan.
Penafian
Maklumat dan penerbitan adalah tidak bertujuan, dan tidak membentuk, nasihat atau cadangan kewangan, pelaburan, dagangan atau jenis lain yang diberikan atau disahkan oleh TradingView. Baca lebih dalam Terma Penggunaan.