📈 Overall Trend & Future Outlook 
 TRXUSDT 🗼
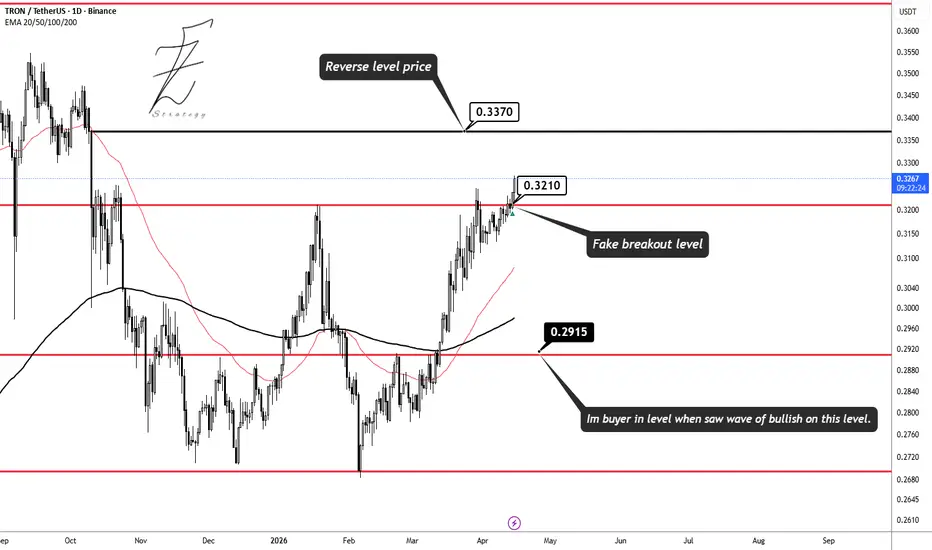
The market maintains a strong bullish trend as price stays above the 200-period EMA with the 50-period EMA acting as dynamic support. Following the recent bullish wave and strong candle bodies, the price is expected to clear the fake breakout zone and reach the next major targets. 🚀
🟢 Key Support Levels
🔴 Key Resistance Levels
⚠️ Notice: This is a technical analysis; please ensure strict risk management in your trades. ⚖️
TRXUSDT 🗼The market maintains a strong bullish trend as price stays above the 200-period EMA with the 50-period EMA acting as dynamic support. Following the recent bullish wave and strong candle bodies, the price is expected to clear the fake breakout zone and reach the next major targets. 🚀
🟢 Key Support Levels
- $0.2915 🛡
- $0.2710 📍
🔴 Key Resistance Levels
- $0.3210 🎯
- $0.3370 🏁
- $0.3650 🛑
⚠️ Notice: This is a technical analysis; please ensure strict risk management in your trades. ⚖️
Nota
A fake breakout of the 0.3210 price level occurred.Dagangan aktif

Penerbitan berkaitan
Penafian
Maklumat dan penerbitan adalah tidak bertujuan, dan tidak membentuk, nasihat atau cadangan kewangan, pelaburan, dagangan atau jenis lain yang diberikan atau disahkan oleh TradingView. Baca lebih dalam Terma Penggunaan.
Penerbitan berkaitan
Penafian
Maklumat dan penerbitan adalah tidak bertujuan, dan tidak membentuk, nasihat atau cadangan kewangan, pelaburan, dagangan atau jenis lain yang diberikan atau disahkan oleh TradingView. Baca lebih dalam Terma Penggunaan.