
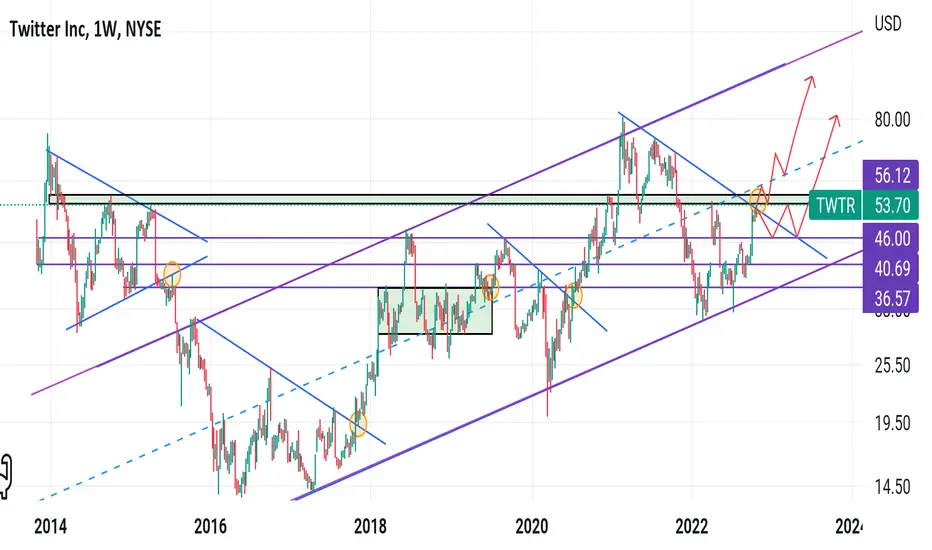
This is the all time weekly chart of twitter usd. The concept is simple and clear for you all in the chart. I mean whether the yellow circle dots mean, the confirmation of the breakout for long and short.
Now the current scenario is, if we close above the 56 level on weekly timeframe. Then the possibility is, that there will be a new all time high coming for the twiterusd token.
And secondly if the the breakout fail, then we can buy at 46 level and open for long term holding target for twitter usd token.
Manage your own risk accordingly with that
Now the current scenario is, if we close above the 56 level on weekly timeframe. Then the possibility is, that there will be a new all time high coming for the twiterusd token.
And secondly if the the breakout fail, then we can buy at 46 level and open for long term holding target for twitter usd token.
Manage your own risk accordingly with that

Penafian
Maklumat dan penerbitan adalah tidak bertujuan, dan tidak membentuk, nasihat atau cadangan kewangan, pelaburan, dagangan atau jenis lain yang diberikan atau disahkan oleh TradingView. Baca lebih dalam Terma Penggunaan.
Penafian
Maklumat dan penerbitan adalah tidak bertujuan, dan tidak membentuk, nasihat atau cadangan kewangan, pelaburan, dagangan atau jenis lain yang diberikan atau disahkan oleh TradingView. Baca lebih dalam Terma Penggunaan.