

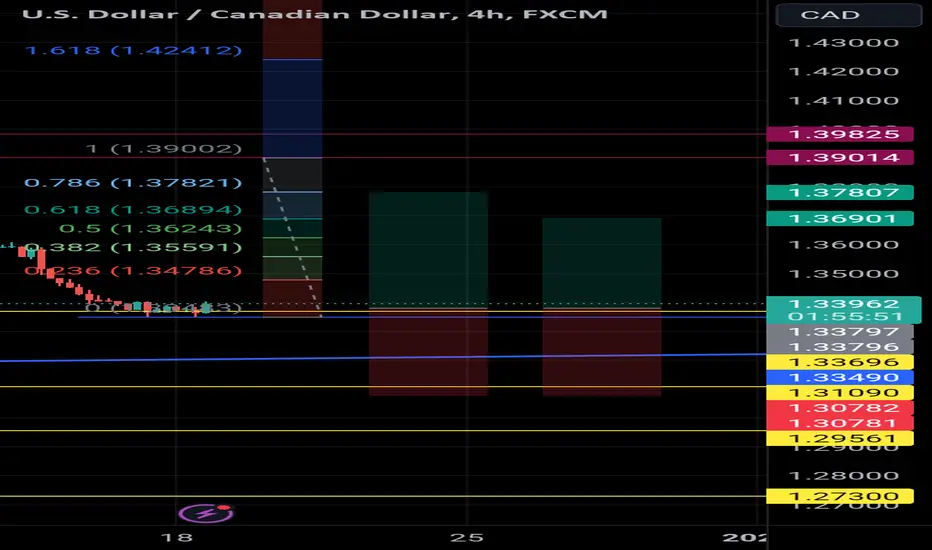
A #long trade opportunity recently presented itself on the #dollarloonie (#USDCAD) #trading chart 📈.
This is indicated by the #bullish harami candlestick 🕯️ pattern on the 1.33696 horizontal support level.
This indicates a fakeout of the same level, with potential price move in the upward 👆 ⬆️ direction (#buy).
Sufficient upward momentum should see price rallying towards the 1.38000 psychological level and possibly testing the strength of the 1.39014 horizontal resistance level.
As always, please apply appropriate risk management.
Happy trading!
#majorpair
This is indicated by the #bullish harami candlestick 🕯️ pattern on the 1.33696 horizontal support level.
This indicates a fakeout of the same level, with potential price move in the upward 👆 ⬆️ direction (#buy).
Sufficient upward momentum should see price rallying towards the 1.38000 psychological level and possibly testing the strength of the 1.39014 horizontal resistance level.
As always, please apply appropriate risk management.
Happy trading!
#majorpair

Penafian
Maklumat dan penerbitan adalah tidak bertujuan, dan tidak membentuk, nasihat atau cadangan kewangan, pelaburan, dagangan atau jenis lain yang diberikan atau disahkan oleh TradingView. Baca lebih dalam Terma Penggunaan.
Penafian
Maklumat dan penerbitan adalah tidak bertujuan, dan tidak membentuk, nasihat atau cadangan kewangan, pelaburan, dagangan atau jenis lain yang diberikan atau disahkan oleh TradingView. Baca lebih dalam Terma Penggunaan.