

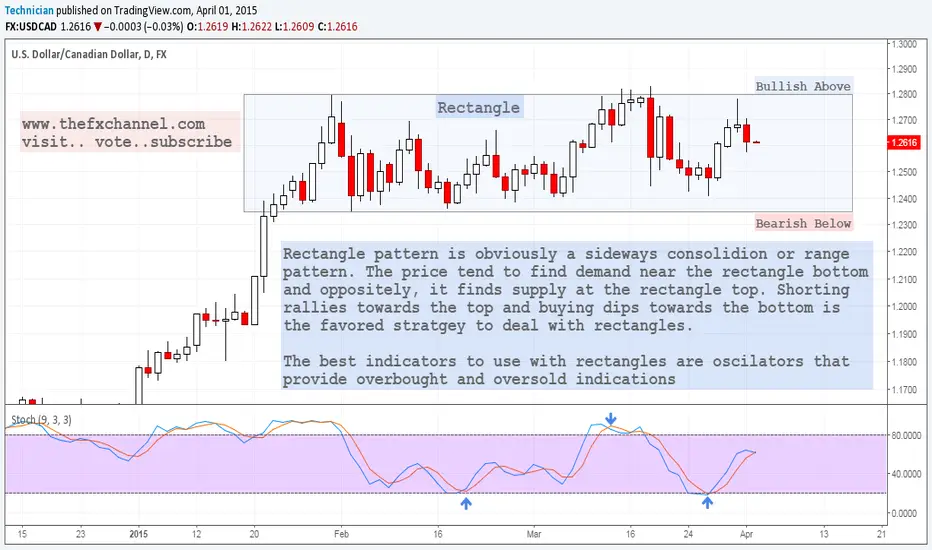
Rectangle pattern is obviously a sideways consolidion or range pattern. The price tend to find demand near the rectangle bottom and oppositely, it finds supply at the rectangle top. Shorting rallies towards the top and buying dips towards the bottom is the favored strategy to deal with rectangles, until PROVEN wrong through a breakout and daily closing.
The best indicators to use with rectangles are oscillators that provide overbought and oversold indications.
Join me, thefxchannel.com visit.. vote..subscribe
Regards,
Technician
The best indicators to use with rectangles are oscillators that provide overbought and oversold indications.
Join me, thefxchannel.com visit.. vote..subscribe
Regards,
Technician

Penerbitan berkaitan
Penafian
Maklumat dan penerbitan adalah tidak bertujuan, dan tidak membentuk, nasihat atau cadangan kewangan, pelaburan, dagangan atau jenis lain yang diberikan atau disahkan oleh TradingView. Baca lebih dalam Terma Penggunaan.
Penerbitan berkaitan
Penafian
Maklumat dan penerbitan adalah tidak bertujuan, dan tidak membentuk, nasihat atau cadangan kewangan, pelaburan, dagangan atau jenis lain yang diberikan atau disahkan oleh TradingView. Baca lebih dalam Terma Penggunaan.