

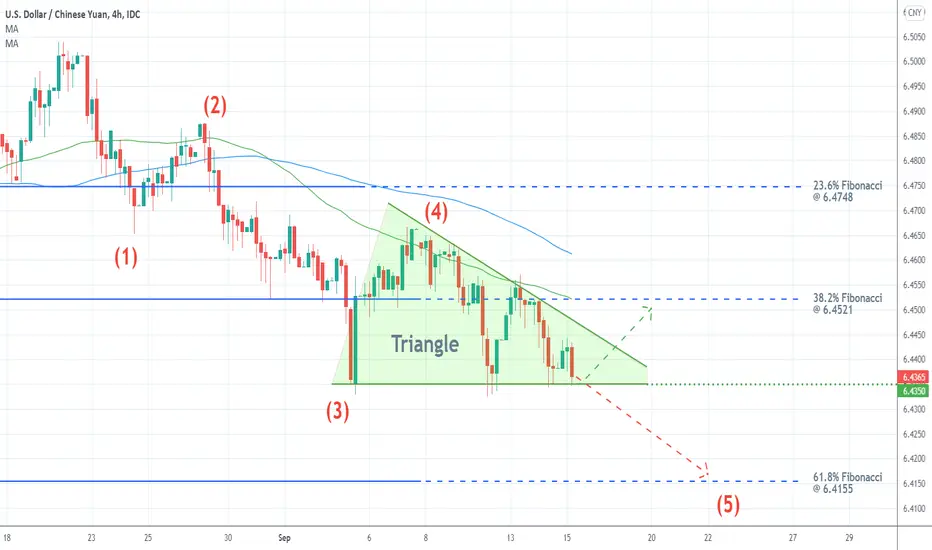
The price of USDCNY is establishing a new downtrend. It is structured as a 1-5 impulse wave pattern, as postulated by the Elliott Wave Theory. After having broken down below the 38.2 per cent Fibonacci retracement level, the price action is currently testing the lower limit of the Triangle.
If it manages to break down below it as well, then the price action would be able to head towards the 61.8 per cent Fibonacci. However, a rebound from the lower limit of the Triangle would see the price action testing the 38.2 per cent Fibonacci from below. The latter is currently converging with the 50-day MA (in green), making it an even more powerful resistance level.
If it manages to break down below it as well, then the price action would be able to head towards the 61.8 per cent Fibonacci. However, a rebound from the lower limit of the Triangle would see the price action testing the 38.2 per cent Fibonacci from below. The latter is currently converging with the 50-day MA (in green), making it an even more powerful resistance level.

Penerbitan berkaitan
Penafian
Maklumat dan penerbitan adalah tidak bertujuan, dan tidak membentuk, nasihat atau cadangan kewangan, pelaburan, dagangan atau jenis lain yang diberikan atau disahkan oleh TradingView. Baca lebih dalam Terma Penggunaan.
Penerbitan berkaitan
Penafian
Maklumat dan penerbitan adalah tidak bertujuan, dan tidak membentuk, nasihat atau cadangan kewangan, pelaburan, dagangan atau jenis lain yang diberikan atau disahkan oleh TradingView. Baca lebih dalam Terma Penggunaan.