
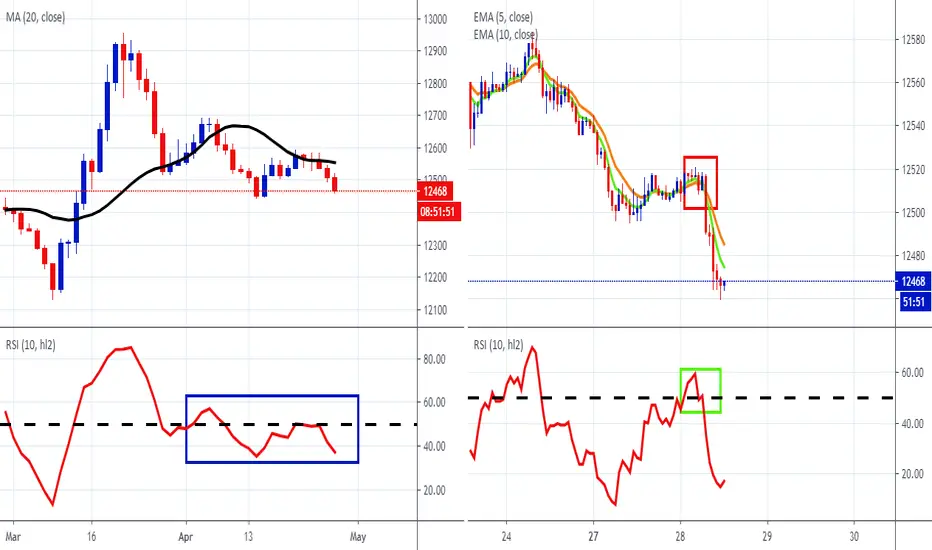
FXCM's USD index, USDOLLAR, has moved into clear risk-off mode. The left chart shows the daily time frame. The index has rejected off of the black 20-day SMA and is moving down. Moreover, the SMA is starting to turn lower, whilst the RSI is also below 50 (blue rectangle) and is suggestive of a bearish momentum. The right chart shows the hourly time frame. Here, the EMAs have turned bearish (red rectangle) and the hourly RSI has crossed below 50 (green rectangle). The greenback is dropping as the Fed's unlimited QE policy takes hold, supporting the risk-on side of the market.

Follow and Trade this analysis from your Charts. FXCM now Integrated with TradingView. Contact FXCM for more information.
Penafian
Maklumat dan penerbitan adalah tidak bertujuan, dan tidak membentuk, nasihat atau cadangan kewangan, pelaburan, dagangan atau jenis lain yang diberikan atau disahkan oleh TradingView. Baca lebih dalam Terma Penggunaan.
Penafian
Maklumat dan penerbitan adalah tidak bertujuan, dan tidak membentuk, nasihat atau cadangan kewangan, pelaburan, dagangan atau jenis lain yang diberikan atau disahkan oleh TradingView. Baca lebih dalam Terma Penggunaan.