
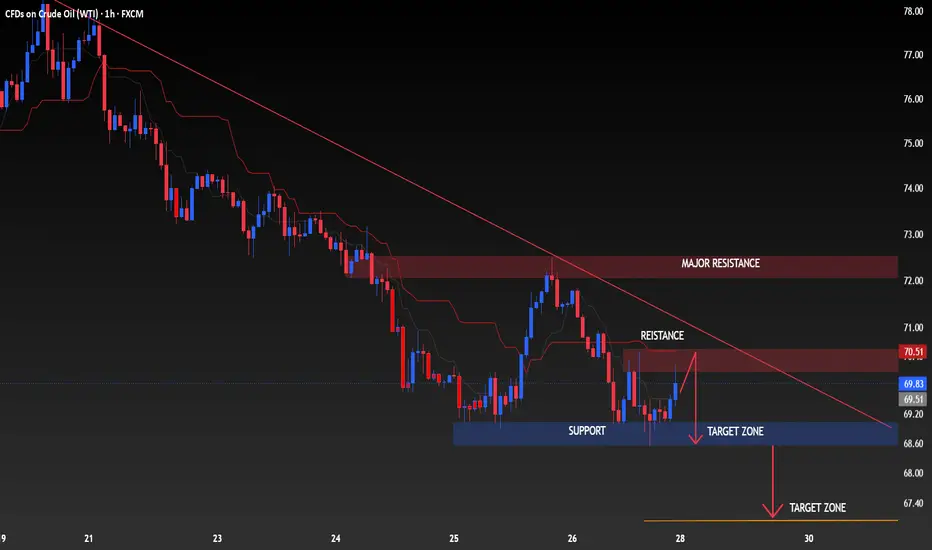
USOIL (WTI) – 1H Time Frame Analysis 📉 (Educational)
Current chart shows overall bearish structure with price trading below the descending trendline and reacting under resistance.
🔴 Sell Scenario (if rejection confirms):
📍 Entry Zone: 69.70 – 70.20
🎯 TP1: 68.60 (support / first target zone)
🎯 TP2: 67.40 (next target zone)
🎯 TP3: 66.50 (extended bearish move)
🛑 SL: Above 70.80 – 71.10
📌 Reasons:
• Price remains below major trendline
• Resistance zone still holding
• Lower highs structure active
• Bearish momentum still visible
⚠️ Wait for 1H candle confirmation before entry and manage risk (1–2%).
Caption:
“USOIL rejecting resistance — bearish continuation remains valid below trendline 📊🔥”
Current chart shows overall bearish structure with price trading below the descending trendline and reacting under resistance.
🔴 Sell Scenario (if rejection confirms):
📍 Entry Zone: 69.70 – 70.20
🎯 TP1: 68.60 (support / first target zone)
🎯 TP2: 67.40 (next target zone)
🎯 TP3: 66.50 (extended bearish move)
🛑 SL: Above 70.80 – 71.10
📌 Reasons:
• Price remains below major trendline
• Resistance zone still holding
• Lower highs structure active
• Bearish momentum still visible
⚠️ Wait for 1H candle confirmation before entry and manage risk (1–2%).
Caption:
“USOIL rejecting resistance — bearish continuation remains valid below trendline 📊🔥”
Dagangan aktif
active 
📲 Join telegram channel free .
t.me/addlist/7jtN1zcz9W05MDVk
Forex, Gold & Crypto Signals with detailed analysis & get consistent results.
Gold Signal's with proper TP & SL for high profit opportunities.
t.me/addlist/7jtN1zcz9W05MDVk
Forex, Gold & Crypto Signals with detailed analysis & get consistent results.
Gold Signal's with proper TP & SL for high profit opportunities.
Penerbitan berkaitan
Penafian
Maklumat dan penerbitan adalah tidak bertujuan, dan tidak membentuk, nasihat atau cadangan kewangan, pelaburan, dagangan atau jenis lain yang diberikan atau disahkan oleh TradingView. Baca lebih dalam Terma Penggunaan.
📲 Join telegram channel free .
t.me/addlist/7jtN1zcz9W05MDVk
Forex, Gold & Crypto Signals with detailed analysis & get consistent results.
Gold Signal's with proper TP & SL for high profit opportunities.
t.me/addlist/7jtN1zcz9W05MDVk
Forex, Gold & Crypto Signals with detailed analysis & get consistent results.
Gold Signal's with proper TP & SL for high profit opportunities.
Penerbitan berkaitan
Penafian
Maklumat dan penerbitan adalah tidak bertujuan, dan tidak membentuk, nasihat atau cadangan kewangan, pelaburan, dagangan atau jenis lain yang diberikan atau disahkan oleh TradingView. Baca lebih dalam Terma Penggunaan.