
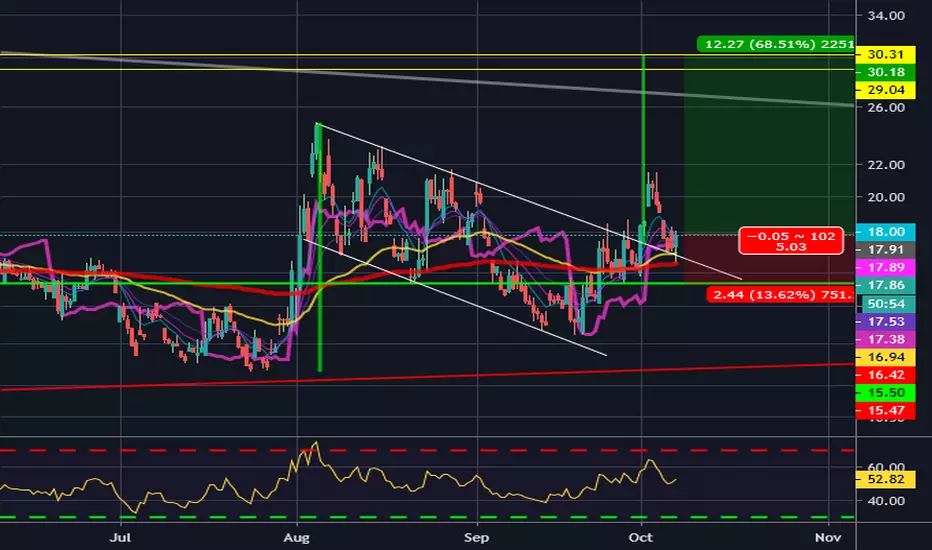
The green, vertical bar is the bullflag pole length as the top yellow line, while the bottom yellow line is the 1.386 fib retracement from the correction down within the bullflag, which combined gives us a projected upside zone between the two yellow lines.
The fact that none of the trade war meetings have resulted in anything tangible and traders nervousness about it, I think this flag could hold.
BUT, if we start breaking back down into the flag and make a lower low, it could lead back down to the bottom of the flag. I find this unlikely, but it is always a possibility.

Penafian
Maklumat dan penerbitan adalah tidak bertujuan, dan tidak membentuk, nasihat atau cadangan kewangan, pelaburan, dagangan atau jenis lain yang diberikan atau disahkan oleh TradingView. Baca lebih dalam Terma Penggunaan.
Penafian
Maklumat dan penerbitan adalah tidak bertujuan, dan tidak membentuk, nasihat atau cadangan kewangan, pelaburan, dagangan atau jenis lain yang diberikan atau disahkan oleh TradingView. Baca lebih dalam Terma Penggunaan.