
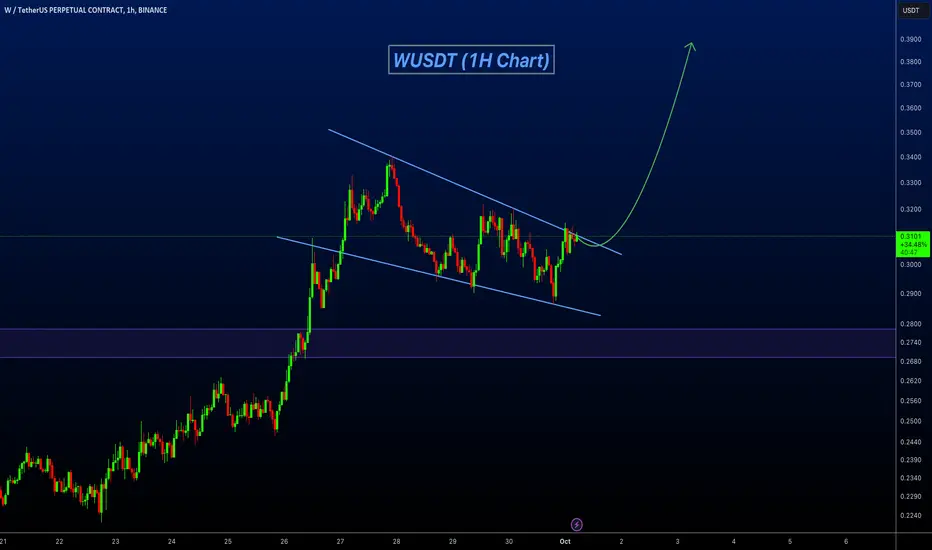
WUSDT technical analysis update
WUSDT has formed a bullish flag pattern on the 1-hour chart, and the price is now moving toward the flag resistance for a potential breakout. The price is currently trading above both the 100 and 200 EMA. Once the breakout is confirmed, we can expect a strong bullish move. Additionally, the price has already broken the double-bottom resistance on the daily chart and formed the flag pattern just above it.
WUSDT has formed a bullish flag pattern on the 1-hour chart, and the price is now moving toward the flag resistance for a potential breakout. The price is currently trading above both the 100 and 200 EMA. Once the breakout is confirmed, we can expect a strong bullish move. Additionally, the price has already broken the double-bottom resistance on the daily chart and formed the flag pattern just above it.

🚀Telegram : t.me/hexatrades
🌐Website: hexatrades.io/
🗣️Twitter(X): twitter.com/HexaTrades
🌐Website: hexatrades.io/
🗣️Twitter(X): twitter.com/HexaTrades
Penerbitan berkaitan
Penafian
Maklumat dan penerbitan adalah tidak bertujuan, dan tidak membentuk, nasihat atau cadangan kewangan, pelaburan, dagangan atau jenis lain yang diberikan atau disahkan oleh TradingView. Baca lebih dalam Terma Penggunaan.
🚀Telegram : t.me/hexatrades
🌐Website: hexatrades.io/
🗣️Twitter(X): twitter.com/HexaTrades
🌐Website: hexatrades.io/
🗣️Twitter(X): twitter.com/HexaTrades
Penerbitan berkaitan
Penafian
Maklumat dan penerbitan adalah tidak bertujuan, dan tidak membentuk, nasihat atau cadangan kewangan, pelaburan, dagangan atau jenis lain yang diberikan atau disahkan oleh TradingView. Baca lebih dalam Terma Penggunaan.