
XAUUSD — Elliott Wave Recovery From 4,286
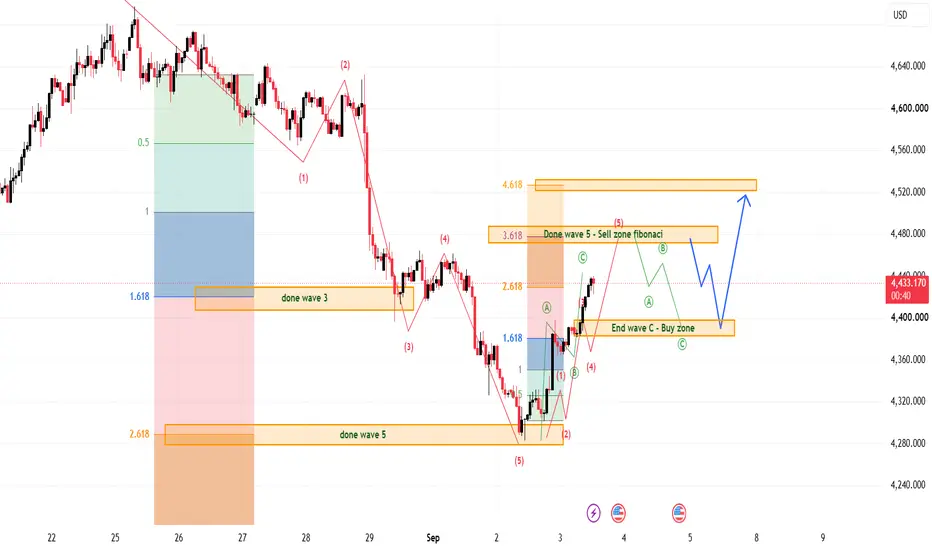
Gold is showing a strong Elliott Wave recovery after completing the previous bearish wave 5 near the 4,286–4,300 demand area. From Kelly’s view, the current chart suggests that XAUUSD has shifted into a short-term bullish correction structure, but price is now approaching an important Fibonacci sell zone where a pullback may appear first.
The key idea is simple: gold may push higher to complete the current upside wave, then correct into the buy zone before continuing toward the next higher Fibonacci target.
⟡ Market Structure
Gold reacted strongly from the done wave 5 area near 4,286–4,300, showing that buyers defended the lower liquidity zone. After that reaction, price built a bullish impulse and is now trading around 4,437.
The current upside structure looks like a developing 5-wave recovery. Price may still have room to test the 4,475–4,490 area, marked as the Done wave 5 / Sell zone Fibonacci. This zone is important because buyers may take profit there, and a short ABC correction can appear.
If price rejects from this Fibonacci zone, the next clean support to watch is the End wave C / Buy zone around 4,385–4,395. If this zone holds, gold may start another bullish leg toward the upper target near 4,520–4,530.
➤ Key Levels
◌ Current price area: 4,437
◌ Done wave 5 / Sell zone Fibonacci: 4,475–4,490
◌ Upper Fibonacci target: 4,520–4,530
◌ End wave C / Buy zone: 4,385–4,395
◌ Strong lower support: 4,286–4,300
◌ Bullish invalidation: below 4,365
⌁ Elliott Wave View
The chart suggests that the previous bearish wave 5 may have already completed around 4,286–4,300.
From that low, gold appears to be building a new bullish recovery:
Wave (1) started from the lower demand zone.
Wave (2) corrected back but held above the recent low.
Wave (3) pushed price higher with stronger momentum.
Wave (4) may create a short pullback.
Wave (5) could finish near 4,475–4,490.
After wave (5) completes, gold may form an ABC correction into 4,385–4,395 before buyers try to continue toward 4,520–4,530.
▸ Trading Scenario
Preferred bullish scenario
Entry: Buy around 4,385–4,395 if price gives bullish confirmation from the End wave C / Buy zone
Stop Loss: Below 4,365
Take Profit 1: 4,475–4,490
Take Profit 2: 4,520–4,530
Alternative scenario
If gold breaks above 4,490 and holds above this zone, the bullish structure may continue directly toward 4,520–4,530 without a deep correction.
◌ Invalidation
The bullish recovery becomes weaker if gold breaks below 4,365 and fails to reclaim the buy zone. In that case, the ABC correction may extend lower, and the bullish continuation setup needs to be delayed.
⌁ Kelly’s View
Kelly’s main view is bullish after the strong reaction from 4,286–4,300, but buying directly into the Fibonacci sell zone is not the cleanest plan.
The better setup is to wait for price to complete the current wave near 4,475–4,490, then watch for an ABC pullback into 4,385–4,395. If buyers defend that zone, gold may continue toward 4,520–4,530.
Do you think gold will complete wave (5) first, or correct into the buy zone before the next rally?
Gold is showing a strong Elliott Wave recovery after completing the previous bearish wave 5 near the 4,286–4,300 demand area. From Kelly’s view, the current chart suggests that XAUUSD has shifted into a short-term bullish correction structure, but price is now approaching an important Fibonacci sell zone where a pullback may appear first.
The key idea is simple: gold may push higher to complete the current upside wave, then correct into the buy zone before continuing toward the next higher Fibonacci target.
⟡ Market Structure
Gold reacted strongly from the done wave 5 area near 4,286–4,300, showing that buyers defended the lower liquidity zone. After that reaction, price built a bullish impulse and is now trading around 4,437.
The current upside structure looks like a developing 5-wave recovery. Price may still have room to test the 4,475–4,490 area, marked as the Done wave 5 / Sell zone Fibonacci. This zone is important because buyers may take profit there, and a short ABC correction can appear.
If price rejects from this Fibonacci zone, the next clean support to watch is the End wave C / Buy zone around 4,385–4,395. If this zone holds, gold may start another bullish leg toward the upper target near 4,520–4,530.
➤ Key Levels
◌ Current price area: 4,437
◌ Done wave 5 / Sell zone Fibonacci: 4,475–4,490
◌ Upper Fibonacci target: 4,520–4,530
◌ End wave C / Buy zone: 4,385–4,395
◌ Strong lower support: 4,286–4,300
◌ Bullish invalidation: below 4,365
⌁ Elliott Wave View
The chart suggests that the previous bearish wave 5 may have already completed around 4,286–4,300.
From that low, gold appears to be building a new bullish recovery:
Wave (1) started from the lower demand zone.
Wave (2) corrected back but held above the recent low.
Wave (3) pushed price higher with stronger momentum.
Wave (4) may create a short pullback.
Wave (5) could finish near 4,475–4,490.
After wave (5) completes, gold may form an ABC correction into 4,385–4,395 before buyers try to continue toward 4,520–4,530.
▸ Trading Scenario
Preferred bullish scenario
Entry: Buy around 4,385–4,395 if price gives bullish confirmation from the End wave C / Buy zone
Stop Loss: Below 4,365
Take Profit 1: 4,475–4,490
Take Profit 2: 4,520–4,530
Alternative scenario
If gold breaks above 4,490 and holds above this zone, the bullish structure may continue directly toward 4,520–4,530 without a deep correction.
◌ Invalidation
The bullish recovery becomes weaker if gold breaks below 4,365 and fails to reclaim the buy zone. In that case, the ABC correction may extend lower, and the bullish continuation setup needs to be delayed.
⌁ Kelly’s View
Kelly’s main view is bullish after the strong reaction from 4,286–4,300, but buying directly into the Fibonacci sell zone is not the cleanest plan.
The better setup is to wait for price to complete the current wave near 4,475–4,490, then watch for an ABC pullback into 4,385–4,395. If buyers defend that zone, gold may continue toward 4,520–4,530.
Do you think gold will complete wave (5) first, or correct into the buy zone before the next rally?

📌 New analysis published daily
🔔 Follow this profile for real-time updates
⚠️ This is personal analysis, not financial advice
Daily GOLD and Forex updates: t.me/+_8wydjUbci5hMzJl
🔔 Follow this profile for real-time updates
⚠️ This is personal analysis, not financial advice
Daily GOLD and Forex updates: t.me/+_8wydjUbci5hMzJl
Penerbitan berkaitan
Penafian
Maklumat dan penerbitan adalah tidak bertujuan, dan tidak membentuk, nasihat atau cadangan kewangan, pelaburan, dagangan atau jenis lain yang diberikan atau disahkan oleh TradingView. Baca lebih dalam Terma Penggunaan.
📌 New analysis published daily
🔔 Follow this profile for real-time updates
⚠️ This is personal analysis, not financial advice
Daily GOLD and Forex updates: t.me/+_8wydjUbci5hMzJl
🔔 Follow this profile for real-time updates
⚠️ This is personal analysis, not financial advice
Daily GOLD and Forex updates: t.me/+_8wydjUbci5hMzJl
Penerbitan berkaitan
Penafian
Maklumat dan penerbitan adalah tidak bertujuan, dan tidak membentuk, nasihat atau cadangan kewangan, pelaburan, dagangan atau jenis lain yang diberikan atau disahkan oleh TradingView. Baca lebih dalam Terma Penggunaan.