
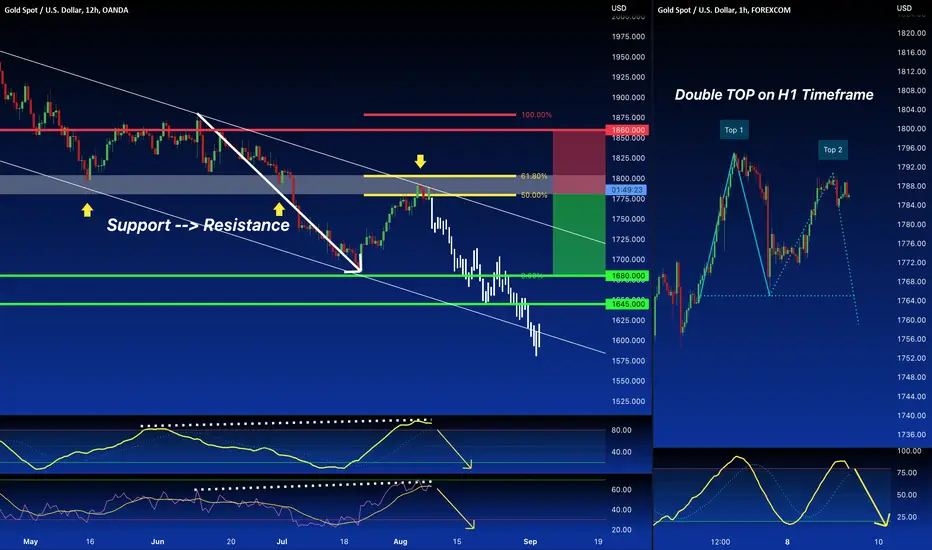
Like Explained Yesterday the GOLD after a long Downtrend, started the retracement ( swing Pullback in direction of the main trend ) , this last one reached the area between 50% and 61.8% Fibonacci right with the confluence of a Resistance area where the price in the past used this Area like support many times before becoming resistance, at today. In the Right of the screen, I put the H1 chart to show you that, in the small time frame there is a formation of a Double TOP pattern with overbought of the stochastic, this last one indicator in higher timeframe ( Left screen ) with the RSI are both in divergence situation with the RSI turned Bearish. Maybe a Drop today in the price but keep in mind, that we are in August and the Trading volume isn't the best one to have a full deep body candle.

Penafian
Maklumat dan penerbitan adalah tidak bertujuan, dan tidak membentuk, nasihat atau cadangan kewangan, pelaburan, dagangan atau jenis lain yang diberikan atau disahkan oleh TradingView. Baca lebih dalam Terma Penggunaan.
Penafian
Maklumat dan penerbitan adalah tidak bertujuan, dan tidak membentuk, nasihat atau cadangan kewangan, pelaburan, dagangan atau jenis lain yang diberikan atau disahkan oleh TradingView. Baca lebih dalam Terma Penggunaan.