
XAU/USD (Gold/US Dollar) Real-Time Market Analysis
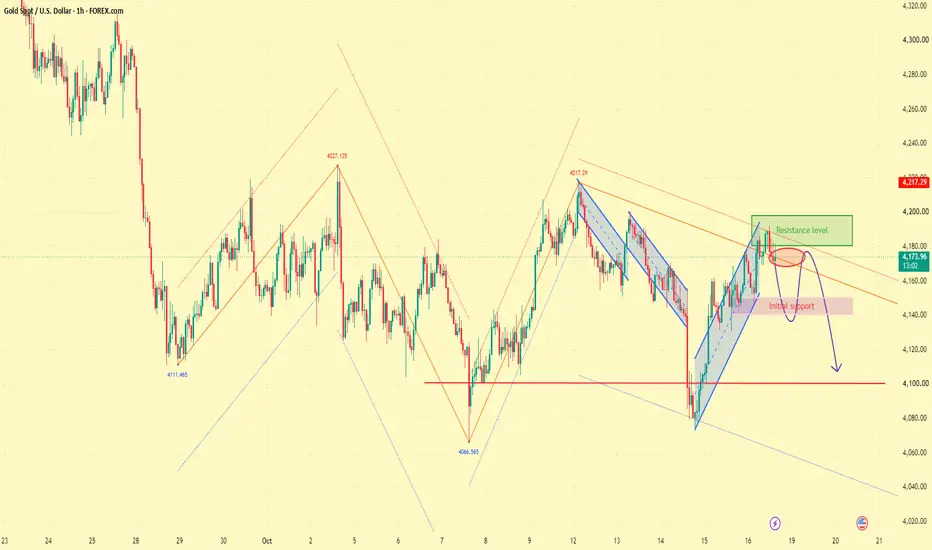
📊 On Thursday, gold found support near 4075 and staged a strong rebound, climbing back above 4160. A weaker US dollar and declining US Treasury yields provided significant macro-level support for this recovery.
Looking at the current market structure, gold has formed a short-term bullish pattern, characterized by a series of higher lows and recovering highs. However, the 4175–4185 zone coincides with a downward-sloping trendline, making it a critical battleground for both bulls and bears. On the upside, key levels to watch are the 4200 mark and the previous high of 4217; a decisive breakout and stabilization above 4217 would further confirm the upward momentum.
On the downside, focus on the 4150–4145 area. As long as gold holds this zone during any pullback and manages to climb back above 4175, the short-term outlook remains tilted toward further gains—potentially reaching 4200 or even 4217. Conversely, if gold falls below 4145 and remains under pressure, the bullish momentum could fade, potentially leading to a retest of the 4110–4100 range.
📌 Current Outlook: Bullish in the short term, though the 4175 zone should not be viewed as an unconditional entry point for long positions. It is advisable to wait for a pullback followed by a confirmation signal before determining the next move, as this will provide a clearer picture of the market structure.
Analytical Framework: The formation of higher lows signals a recovery, while the overhead trendline acts as a key resistance level that must be cleared. As long as support levels remain firm, the bullish structure stays intact; a successful breakout above the overhead resistance would open the door for further upside.
📊 On Thursday, gold found support near 4075 and staged a strong rebound, climbing back above 4160. A weaker US dollar and declining US Treasury yields provided significant macro-level support for this recovery.
Looking at the current market structure, gold has formed a short-term bullish pattern, characterized by a series of higher lows and recovering highs. However, the 4175–4185 zone coincides with a downward-sloping trendline, making it a critical battleground for both bulls and bears. On the upside, key levels to watch are the 4200 mark and the previous high of 4217; a decisive breakout and stabilization above 4217 would further confirm the upward momentum.
On the downside, focus on the 4150–4145 area. As long as gold holds this zone during any pullback and manages to climb back above 4175, the short-term outlook remains tilted toward further gains—potentially reaching 4200 or even 4217. Conversely, if gold falls below 4145 and remains under pressure, the bullish momentum could fade, potentially leading to a retest of the 4110–4100 range.
📌 Current Outlook: Bullish in the short term, though the 4175 zone should not be viewed as an unconditional entry point for long positions. It is advisable to wait for a pullback followed by a confirmation signal before determining the next move, as this will provide a clearer picture of the market structure.
Analytical Framework: The formation of higher lows signals a recovery, while the overhead trendline acts as a key resistance level that must be cleared. As long as support levels remain firm, the bullish structure stays intact; a successful breakout above the overhead resistance would open the door for further upside.
Dagangan aktif
📊 XAUUSD 15-Minute Technical AnalysisFollowing a rebound toward the 4185–4190 range, upward pressure has intensified, with short-term candlesticks showing signs of resistance at these elevated levels. Given the pressure from the descending trendline and the current short-term market structure, the focus is now on a potential pullback following this rally.
If the 4185–4190 zone fails to break, look for a pullback toward 4175 → 4165 → 4155. Conversely, should the price break above 4220, the existing bearish setup will be invalidated, necessitating a re-evaluation.
🔴 SELL: 4185–4190
🛡️ SL: 4220
🎯 TP1: 4175 | TP2: 4165 | TP3: 4155
Strategy: Resistance confirmation + structural resistance + potential for a pullback; use the actual price action as the basis for determining the subsequent direction.

Sharing my daily insights
t.me/+pbvj9XFxjRcwNmNh
t.me/+pbvj9XFxjRcwNmNh
Penafian
Maklumat dan penerbitan adalah tidak bertujuan, dan tidak membentuk, nasihat atau cadangan kewangan, pelaburan, dagangan atau jenis lain yang diberikan atau disahkan oleh TradingView. Baca lebih dalam Terma Penggunaan.
Sharing my daily insights
t.me/+pbvj9XFxjRcwNmNh
t.me/+pbvj9XFxjRcwNmNh
Penafian
Maklumat dan penerbitan adalah tidak bertujuan, dan tidak membentuk, nasihat atau cadangan kewangan, pelaburan, dagangan atau jenis lain yang diberikan atau disahkan oleh TradingView. Baca lebih dalam Terma Penggunaan.