
Fundamental Analysis
Gold remains under bearish pressure as price continues to trade below the main EMA structure. Traders are still watching USD momentum, Treasury yields, and upcoming U.S. macro data.
For now, the technical structure still favours sellers while recovery attempts remain weak below the EMA resistance zone.
Technical Analysis
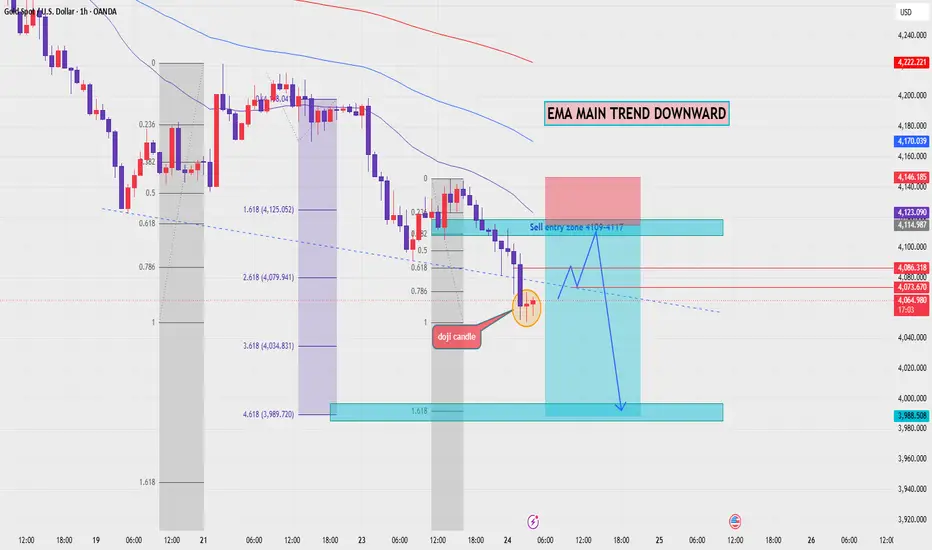
On the 1H chart, XAUUSD is trading below EMA 34, EMA 89, and EMA 200. The EMA structure is still pointing downward, confirming that the main trend remains bearish.
Price recently created a doji candle near the lower area around 4,060 - 4,070, showing short-term hesitation after the sell-off. However, this doji is not enough to confirm a bullish reversal while price remains below the EMA trend.
The key sell entry zone is around 4,109 - 4,117. This area aligns with the Fibonacci retracement zone, broken structure, and EMA resistance pressure. If price pulls back into this zone and rejects, the bearish continuation setup becomes cleaner.
The main downside target is around 3,989, which aligns with the Fibonacci extension area and lower liquidity zone on the chart.
Important Key Levels
Current price area: 4,064
Fibonacci sell entry zone: 4,109 - 4,117
EMA resistance area: 4,123 - 4,170
Short-term resistance: 4,086
Bearish continuation level: 4,073 - 4,064
Main Fibonacci target: 3,989
Invalidation area: above 4,146
Trading Scenario
Main Sell Scenario
Entry: 4,109 - 4,117
Stop Loss: 4,146
Take Profit 1: 4,086
Take Profit 2: 4,034
Take Profit 3: 3,989
Sell Condition
The preferred setup is to wait for gold to pull back into the 4,109 - 4,117 Fibonacci sell entry zone. This area is important because it aligns with the EMA downtrend and the previous broken structure.
A sell setup becomes more valid if price forms bearish rejection from this zone, such as a long upper wick, bearish engulfing candle, failed breakout, or lower high below the EMA range.
If price rejects from the sell zone and breaks below 4,064 again, the bearish continuation view becomes stronger. The next downside focus would be 4,034, followed by the Fibonacci extension target around 3,989.
Entry Conditions
Wait for price to retest 4,109 - 4,117.
Look for bearish rejection before entering sell.
A break below 4,064 confirms stronger downside pressure.
If price breaks and holds above 4,146, the sell setup is invalid.
Overall, the main view remains bearish while XAUUSD trades below EMA 34, EMA 89, and EMA 200. The preferred plan is to wait for a pullback into the Fibonacci sell entry zone, then look for sell confirmation toward 4,034 and 3,989.
Do you share the same bearish view on gold, or are you waiting for a cleaner rejection from the Fibonacci sell zone?
Gold remains under bearish pressure as price continues to trade below the main EMA structure. Traders are still watching USD momentum, Treasury yields, and upcoming U.S. macro data.
For now, the technical structure still favours sellers while recovery attempts remain weak below the EMA resistance zone.
Technical Analysis
On the 1H chart, XAUUSD is trading below EMA 34, EMA 89, and EMA 200. The EMA structure is still pointing downward, confirming that the main trend remains bearish.
Price recently created a doji candle near the lower area around 4,060 - 4,070, showing short-term hesitation after the sell-off. However, this doji is not enough to confirm a bullish reversal while price remains below the EMA trend.
The key sell entry zone is around 4,109 - 4,117. This area aligns with the Fibonacci retracement zone, broken structure, and EMA resistance pressure. If price pulls back into this zone and rejects, the bearish continuation setup becomes cleaner.
The main downside target is around 3,989, which aligns with the Fibonacci extension area and lower liquidity zone on the chart.
Important Key Levels
Current price area: 4,064
Fibonacci sell entry zone: 4,109 - 4,117
EMA resistance area: 4,123 - 4,170
Short-term resistance: 4,086
Bearish continuation level: 4,073 - 4,064
Main Fibonacci target: 3,989
Invalidation area: above 4,146
Trading Scenario
Main Sell Scenario
Entry: 4,109 - 4,117
Stop Loss: 4,146
Take Profit 1: 4,086
Take Profit 2: 4,034
Take Profit 3: 3,989
Sell Condition
The preferred setup is to wait for gold to pull back into the 4,109 - 4,117 Fibonacci sell entry zone. This area is important because it aligns with the EMA downtrend and the previous broken structure.
A sell setup becomes more valid if price forms bearish rejection from this zone, such as a long upper wick, bearish engulfing candle, failed breakout, or lower high below the EMA range.
If price rejects from the sell zone and breaks below 4,064 again, the bearish continuation view becomes stronger. The next downside focus would be 4,034, followed by the Fibonacci extension target around 3,989.
Entry Conditions
Wait for price to retest 4,109 - 4,117.
Look for bearish rejection before entering sell.
A break below 4,064 confirms stronger downside pressure.
If price breaks and holds above 4,146, the sell setup is invalid.
Overall, the main view remains bearish while XAUUSD trades below EMA 34, EMA 89, and EMA 200. The preferred plan is to wait for a pullback into the Fibonacci sell entry zone, then look for sell confirmation toward 4,034 and 3,989.
Do you share the same bearish view on gold, or are you waiting for a cleaner rejection from the Fibonacci sell zone?

📊 XAU Macro Pulse · XAUUSD · GBPUSD · EURUSD
Every setup earns its place on the chart.
🔔 Follow the structure. The rest is noise.
Personal analysis only t.me/+ZahF8It14l40OWNl
Every setup earns its place on the chart.
🔔 Follow the structure. The rest is noise.
Personal analysis only t.me/+ZahF8It14l40OWNl
Penerbitan berkaitan
Penafian
Maklumat dan penerbitan adalah tidak bertujuan, dan tidak membentuk, nasihat atau cadangan kewangan, pelaburan, dagangan atau jenis lain yang diberikan atau disahkan oleh TradingView. Baca lebih dalam Terma Penggunaan.
📊 XAU Macro Pulse · XAUUSD · GBPUSD · EURUSD
Every setup earns its place on the chart.
🔔 Follow the structure. The rest is noise.
Personal analysis only t.me/+ZahF8It14l40OWNl
Every setup earns its place on the chart.
🔔 Follow the structure. The rest is noise.
Personal analysis only t.me/+ZahF8It14l40OWNl
Penerbitan berkaitan
Penafian
Maklumat dan penerbitan adalah tidak bertujuan, dan tidak membentuk, nasihat atau cadangan kewangan, pelaburan, dagangan atau jenis lain yang diberikan atau disahkan oleh TradingView. Baca lebih dalam Terma Penggunaan.