
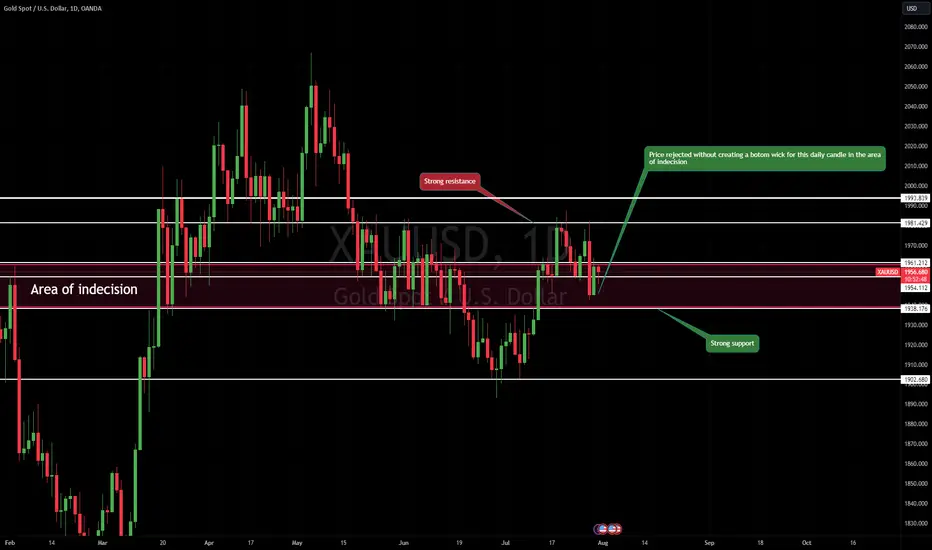
Looking at the daily timeframe after Fridays bullish closure hints at price wanting to continue up after creating a new support in the AOI marked in red
The only issue is that the daily candle has no bottom wick so I would anticipate a liquidity grab of this area before we can see price continue.
This morning saw a liquidity grab on the 1950 level which was to be expected as it broke the recent lows, so any move up from here would see price test 1960-1962 where I would wait for confirmation for sells back down.
The only issue is that the daily candle has no bottom wick so I would anticipate a liquidity grab of this area before we can see price continue.
This morning saw a liquidity grab on the 1950 level which was to be expected as it broke the recent lows, so any move up from here would see price test 1960-1962 where I would wait for confirmation for sells back down.

Penafian
Maklumat dan penerbitan adalah tidak bertujuan, dan tidak membentuk, nasihat atau cadangan kewangan, pelaburan, dagangan atau jenis lain yang diberikan atau disahkan oleh TradingView. Baca lebih dalam Terma Penggunaan.
Penafian
Maklumat dan penerbitan adalah tidak bertujuan, dan tidak membentuk, nasihat atau cadangan kewangan, pelaburan, dagangan atau jenis lain yang diberikan atau disahkan oleh TradingView. Baca lebih dalam Terma Penggunaan.