
● The Cardwell RSI Range-Shift Strategy: A Regime-Based Reinterpretation of the Relative Strength Index Using the 40/80 and 20/60 Range Rules
● Abstract
The Relative Strength Index (RSI), introduced by J. Welles Wilder in 1978, is among the most widely used momentum oscillators in technical analysis. Its conventional application relies on fixed overbought and oversold thresholds of 70 and 30. Andrew Cardwell, a technical analyst who studied momentum behavior extensively over several decades and who is frequently described in the trading literature as the leading authority on RSI interpretation after Wilder himself, proposed a substantial refinement of this framework. Cardwell observed that the oscillator's effective operating range is not fixed but shifts according to the prevailing market regime: in bull markets the RSI tends to oscillate between 40 and 80, while in bear markets it tends to oscillate between 20 and 60. This article examines the theoretical foundations of the Cardwell range-shift methodology, its practical decision rules, its integration with broader trend-identification concepts, and its limitations as an analytical, rather than purely mechanical, trading framework.
● 1. Introduction
Momentum oscillators occupy a central place in technical market analysis because they attempt to quantify the speed and magnitude of price change rather than price level alone. Wilder's original RSI formulation compresses price momentum into a bounded scale from 0 to 100 and designates readings above 70 as overbought and readings below 30 as oversold, implying an elevated probability of reversal at these extremes.
In practice, this static reading produces a well-documented weakness: during sustained directional trends, the RSI can remain at or near an extreme for long periods without the anticipated reversal occurring. A trader who shorts every instance of RSI above 70 in a strong uptrend, or who buys every instance of RSI below 30 in a strong downtrend, tends to accumulate losing trades precisely because the 70/30 framework was designed for range-bound, non-trending conditions rather than for markets exhibiting sustained directional momentum.
Cardwell's contribution was to recognize that this apparent flaw is, in fact, informative: the manner in which the RSI fails to behave according to the normal 30/70 range is itself a signal of the character of the prevailing trend. Rather than treating range violations as noise, Cardwell reclassified the entire operating band of the indicator according to market regime, producing the 40/80 and 20/60 range rules that form the basis of the strategy discussed here.
● 2. Theoretical Basis: Why the Range Shifts
The logic underlying Cardwell's adjustment rests on an asymmetry in trader psychology and in the statistical behavior of gains versus losses during directional markets. During a sustained uptrend, upward price movements are both more frequent and often larger in magnitude than the corrective declines that interrupt them; because RSI is calculated from the ratio of average gains to average losses over a lookback period, this asymmetry mechanically compresses the indicator's lower boundary upward and permits its upper boundary to extend further before an actual reversal occurs.
The symmetric logic applies in a bear market: sustained downward momentum, driven by distribution and the progressive withdrawal of buying interest, compresses the RSI's upper boundary downward, such that rallies within the downtrend struggle to lift the oscillator materially above 60, while oversold extremes can extend well beyond the traditional 30 threshold down toward 20.
Cardwell therefore proposed that the same forty-point span used in the normal range (the distance between 30 and 70) be preserved but repositioned according to regime: shifted upward by ten points to 40-80 in a bull market, and shifted downward by ten points to 20-60 in a bear market. This preserves the internal proportions of the oscillator while adapting its reference points to the trend environment in which it is being read.
● 3. The Core Range Rules
The complete set of range parameters used in the Cardwell method, as commonly presented in the technical analysis literature, is as follows.
In a normal, range-bound market, the overbought boundary sits at 70 and the oversold boundary sits at 30. In a bull market, or uptrend, these boundaries shift upward: the overbought boundary rises to 80 and the oversold boundary rises to 40. In a bear market, or downtrend, the boundaries shift downward: the overbought boundary falls to 60 and the oversold boundary falls to 20.
Within this framework, the levels of 40 and 60 assume particular diagnostic importance as "trend-confirmation" boundaries. In an established uptrend, RSI pullbacks are expected to find support at or above the 40 level; a sustained close below 40 is treated as a warning that the bullish regime may be deteriorating. In an established downtrend, RSI rallies are expected to encounter resistance at or below the 60 level; a sustained close above 60 is treated as a warning that the bearish regime may be ending. These interior boundaries are often more informative for early trend-change detection than the outer 80/20 extremes, because they are tested more frequently during normal trend pullbacks and rallies.
● 4. Range Rules as a Quadrant Framework
A useful way to visualize the range-shift concept is to compare the two regimes directly on a shared 0-100 axis. One arrangement places the 80/40 bull range above the 60/20 bear range; a second arrangement reverses the visual order to emphasize the transition from a bear regime, occupying the lower band, to a bull regime, occupying the upper band.
This quadrant structure clarifies the central diagnostic task facing the analyst: determining which of the two forty-point bands the RSI is currently respecting, and identifying the moment at which the oscillator migrates from one band to the other. When the RSI applies the 80/40 range while sitting in the upper zone between 60 and 100, this confirms a bull regime. When it applies the 60/20 range while sitting in the lower zone between 0 and 60, this confirms a bear regime. When the RSI is still working within the 60/20 range in the lower zone but has not yet broken out, the analyst should watch for a possible reversal out of the bear regime. Finally, when the RSI has moved into the upper zone and begun respecting the 80/40 range instead, this indicates that the regime has migrated from bear to bull. That migration, referred to in the literature as a "range shift," is treated as one of the earliest reliable indications that the underlying trend itself has changed.
● 5. Range Analysis in the Context of the Full RSI Scale
Cardwell's 40/80/20/60 framework is best understood as a refinement layered on top of the complete zero-to-one-hundred RSI scale, rather than a replacement for it. The fuller structure distinguishes extreme overbought and oversold territory from the initial overbought/oversold zones, and identifies the 50 level as the basis, or midpoint, that separates positive momentum readings from negative ones.
The full set of parameters can be summarized as: the value of RSI ranges from 0 to 100; the normal range is 70/30; the bull range is 80/40; the bear range is 60/20; the overbought/oversold extremes are set at 80/20; and the mid-point, or basis level, is 50.
Reading the scale from top to bottom, above 80 lies extreme overbought territory; between 70 and 80 lies the initial overbought zone; between 50 and 70 lies positive territory; between 30 and 50 lies negative territory; between 20 and 30 lies the initial oversold zone; and below 20 lies extreme oversold territory.
Within this structure, the 50 level operates as a coarse trend filter: RSI readings persistently above 50 are associated with net-positive momentum, while readings persistently below 50 are associated with net-negative momentum. The 70/30 boundaries define the conventional overbought/oversold zones appropriate to non-trending, range-bound conditions. The 80/20 boundaries mark more extreme conditions used across both regime interpretations. The Cardwell contribution operates as an intermediate layer, using the 40 and 60 levels specifically to determine which of the two regime-shifted ranges is currently governing price behavior.
● 6. Trend Identification and the Role of Short-, Intermediate-, and Long-Term Turns
A further component of the broader Cardwell-style approach to trend reading concerns the sequencing of turning points across multiple time horizons. In a developing positive trend, analysts commonly distinguish three successive stages. First, the short-term trend turns up, offering the earliest and most tentative signal of change. Second, the intermediate trend turns up, as the short-term move gains persistence and confirmation. Third, the intermediate-to-long-term trend turns up, marking the point at which the broader trend begins its upside acceleration.
The mirror sequence characterizes a developing negative trend: first the short-term trend turns down, then the intermediate trend turns down, and finally the intermediate-to-long-term trend turns down, marking the beginning of downside acceleration.
This sequencing framework is complementary to the RSI range-shift methodology rather than a substitute for it. Range shifts in the RSI are typically expected to appear in tandem with, or in some cases slightly ahead of, the intermediate-term price turn, giving the range-shift signal practical value as a corroborating, and occasionally leading, indicator of a developing change in the longer-term trend.
● 7. Practical Application and Decision Rules
The regime-based range rules translate into a small number of operational guidelines that recur consistently across the technical analysis literature on this method.
● 8. Limitations and Critical Considerations
Several caveats accompany the practical use of this framework.
● 9. Conclusion
Andrew Cardwell's regime-based reinterpretation of the RSI represents a meaningful conceptual advance over the traditional static 70/30 framework. By recognizing that the oscillator's effective range migrates predictably with the character of the prevailing trend, and by formalizing this migration into the 40/80 bull range and 20/60 bear range, Cardwell provided technical analysts with a tool that is explicitly sensitive to trend context. The interior 40 and 60 boundaries, in particular, function as accessible early-warning levels for trend continuation or exhaustion, complementing the broader multi-horizon trend-turn sequencing that underlies classical technical trend analysis. As with any technical framework, the range-shift methodology is best deployed as one component of a broader analytical process rather than as an isolated, purely mechanical trading rule.
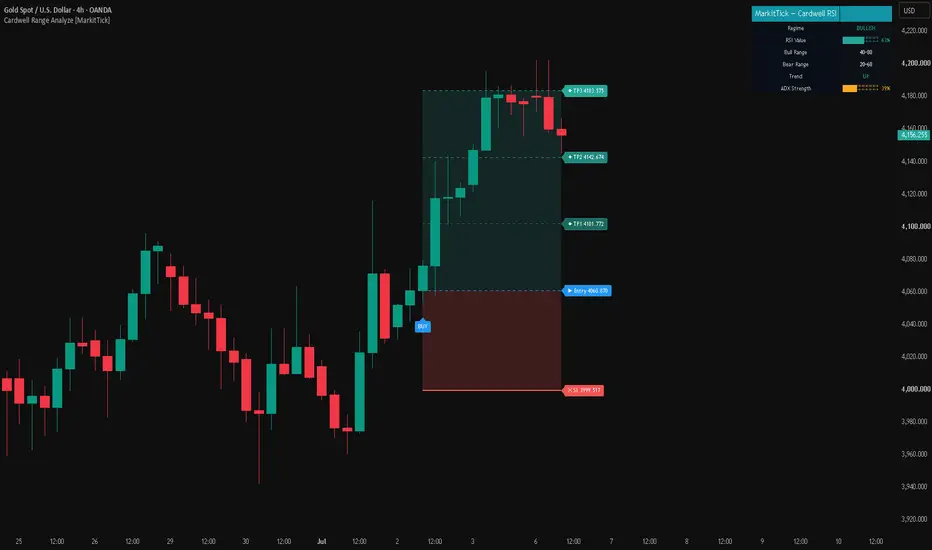
Cardwell Range Analyze applies the regime-based range rules discussed above, shifting the effective RSI bounds from the standard 30/70 to 40/80 in bull trends and 20/60 in bear trends. The 40 and 60 levels serve as the trend-confirmation boundaries described in Section 3, providing an early indication of a range shift before it is confirmed by price. As with the broader methodology, a failure to clear 60 in an uptrend, or a failure to hold above 40 in a downtrend, should be read as a warning sign within a wider weight-of-evidence approach rather than as an isolated signal.
● References
⚠️Disclaimer
This article is for educational purposes only and does not constitute financial, investment, or trading advice. All quantitative frameworks discussed are theoretical and carry inherent risks; past performance is never indicative of future results. You are solely responsible for your own investment decisions, risk management, and any financial losses incurred. No content herein guarantees profit or success in real-world market environments. Please consult with a qualified financial advisor before deploying any strategies.
● Abstract
The Relative Strength Index (RSI), introduced by J. Welles Wilder in 1978, is among the most widely used momentum oscillators in technical analysis. Its conventional application relies on fixed overbought and oversold thresholds of 70 and 30. Andrew Cardwell, a technical analyst who studied momentum behavior extensively over several decades and who is frequently described in the trading literature as the leading authority on RSI interpretation after Wilder himself, proposed a substantial refinement of this framework. Cardwell observed that the oscillator's effective operating range is not fixed but shifts according to the prevailing market regime: in bull markets the RSI tends to oscillate between 40 and 80, while in bear markets it tends to oscillate between 20 and 60. This article examines the theoretical foundations of the Cardwell range-shift methodology, its practical decision rules, its integration with broader trend-identification concepts, and its limitations as an analytical, rather than purely mechanical, trading framework.
● 1. Introduction
Momentum oscillators occupy a central place in technical market analysis because they attempt to quantify the speed and magnitude of price change rather than price level alone. Wilder's original RSI formulation compresses price momentum into a bounded scale from 0 to 100 and designates readings above 70 as overbought and readings below 30 as oversold, implying an elevated probability of reversal at these extremes.
In practice, this static reading produces a well-documented weakness: during sustained directional trends, the RSI can remain at or near an extreme for long periods without the anticipated reversal occurring. A trader who shorts every instance of RSI above 70 in a strong uptrend, or who buys every instance of RSI below 30 in a strong downtrend, tends to accumulate losing trades precisely because the 70/30 framework was designed for range-bound, non-trending conditions rather than for markets exhibiting sustained directional momentum.
Cardwell's contribution was to recognize that this apparent flaw is, in fact, informative: the manner in which the RSI fails to behave according to the normal 30/70 range is itself a signal of the character of the prevailing trend. Rather than treating range violations as noise, Cardwell reclassified the entire operating band of the indicator according to market regime, producing the 40/80 and 20/60 range rules that form the basis of the strategy discussed here.
● 2. Theoretical Basis: Why the Range Shifts
The logic underlying Cardwell's adjustment rests on an asymmetry in trader psychology and in the statistical behavior of gains versus losses during directional markets. During a sustained uptrend, upward price movements are both more frequent and often larger in magnitude than the corrective declines that interrupt them; because RSI is calculated from the ratio of average gains to average losses over a lookback period, this asymmetry mechanically compresses the indicator's lower boundary upward and permits its upper boundary to extend further before an actual reversal occurs.
The symmetric logic applies in a bear market: sustained downward momentum, driven by distribution and the progressive withdrawal of buying interest, compresses the RSI's upper boundary downward, such that rallies within the downtrend struggle to lift the oscillator materially above 60, while oversold extremes can extend well beyond the traditional 30 threshold down toward 20.
Cardwell therefore proposed that the same forty-point span used in the normal range (the distance between 30 and 70) be preserved but repositioned according to regime: shifted upward by ten points to 40-80 in a bull market, and shifted downward by ten points to 20-60 in a bear market. This preserves the internal proportions of the oscillator while adapting its reference points to the trend environment in which it is being read.
● 3. The Core Range Rules
The complete set of range parameters used in the Cardwell method, as commonly presented in the technical analysis literature, is as follows.
In a normal, range-bound market, the overbought boundary sits at 70 and the oversold boundary sits at 30. In a bull market, or uptrend, these boundaries shift upward: the overbought boundary rises to 80 and the oversold boundary rises to 40. In a bear market, or downtrend, the boundaries shift downward: the overbought boundary falls to 60 and the oversold boundary falls to 20.
Within this framework, the levels of 40 and 60 assume particular diagnostic importance as "trend-confirmation" boundaries. In an established uptrend, RSI pullbacks are expected to find support at or above the 40 level; a sustained close below 40 is treated as a warning that the bullish regime may be deteriorating. In an established downtrend, RSI rallies are expected to encounter resistance at or below the 60 level; a sustained close above 60 is treated as a warning that the bearish regime may be ending. These interior boundaries are often more informative for early trend-change detection than the outer 80/20 extremes, because they are tested more frequently during normal trend pullbacks and rallies.
● 4. Range Rules as a Quadrant Framework
A useful way to visualize the range-shift concept is to compare the two regimes directly on a shared 0-100 axis. One arrangement places the 80/40 bull range above the 60/20 bear range; a second arrangement reverses the visual order to emphasize the transition from a bear regime, occupying the lower band, to a bull regime, occupying the upper band.
This quadrant structure clarifies the central diagnostic task facing the analyst: determining which of the two forty-point bands the RSI is currently respecting, and identifying the moment at which the oscillator migrates from one band to the other. When the RSI applies the 80/40 range while sitting in the upper zone between 60 and 100, this confirms a bull regime. When it applies the 60/20 range while sitting in the lower zone between 0 and 60, this confirms a bear regime. When the RSI is still working within the 60/20 range in the lower zone but has not yet broken out, the analyst should watch for a possible reversal out of the bear regime. Finally, when the RSI has moved into the upper zone and begun respecting the 80/40 range instead, this indicates that the regime has migrated from bear to bull. That migration, referred to in the literature as a "range shift," is treated as one of the earliest reliable indications that the underlying trend itself has changed.
● 5. Range Analysis in the Context of the Full RSI Scale
Cardwell's 40/80/20/60 framework is best understood as a refinement layered on top of the complete zero-to-one-hundred RSI scale, rather than a replacement for it. The fuller structure distinguishes extreme overbought and oversold territory from the initial overbought/oversold zones, and identifies the 50 level as the basis, or midpoint, that separates positive momentum readings from negative ones.
The full set of parameters can be summarized as: the value of RSI ranges from 0 to 100; the normal range is 70/30; the bull range is 80/40; the bear range is 60/20; the overbought/oversold extremes are set at 80/20; and the mid-point, or basis level, is 50.
Reading the scale from top to bottom, above 80 lies extreme overbought territory; between 70 and 80 lies the initial overbought zone; between 50 and 70 lies positive territory; between 30 and 50 lies negative territory; between 20 and 30 lies the initial oversold zone; and below 20 lies extreme oversold territory.
Within this structure, the 50 level operates as a coarse trend filter: RSI readings persistently above 50 are associated with net-positive momentum, while readings persistently below 50 are associated with net-negative momentum. The 70/30 boundaries define the conventional overbought/oversold zones appropriate to non-trending, range-bound conditions. The 80/20 boundaries mark more extreme conditions used across both regime interpretations. The Cardwell contribution operates as an intermediate layer, using the 40 and 60 levels specifically to determine which of the two regime-shifted ranges is currently governing price behavior.
● 6. Trend Identification and the Role of Short-, Intermediate-, and Long-Term Turns
A further component of the broader Cardwell-style approach to trend reading concerns the sequencing of turning points across multiple time horizons. In a developing positive trend, analysts commonly distinguish three successive stages. First, the short-term trend turns up, offering the earliest and most tentative signal of change. Second, the intermediate trend turns up, as the short-term move gains persistence and confirmation. Third, the intermediate-to-long-term trend turns up, marking the point at which the broader trend begins its upside acceleration.
The mirror sequence characterizes a developing negative trend: first the short-term trend turns down, then the intermediate trend turns down, and finally the intermediate-to-long-term trend turns down, marking the beginning of downside acceleration.
This sequencing framework is complementary to the RSI range-shift methodology rather than a substitute for it. Range shifts in the RSI are typically expected to appear in tandem with, or in some cases slightly ahead of, the intermediate-term price turn, giving the range-shift signal practical value as a corroborating, and occasionally leading, indicator of a developing change in the longer-term trend.
● 7. Practical Application and Decision Rules
The regime-based range rules translate into a small number of operational guidelines that recur consistently across the technical analysis literature on this method.
- The first step is regime identification: establishing whether the market is currently in a bull or bear regime, commonly approximated using a longer-term moving average, such as price relative to its 200-period average, before selecting which RSI range to apply.
- The second is treating the interior boundary as support or resistance: in a bull regime, RSI pullbacks toward 40 are treated as a potential buying opportunity, provided the 40 level holds; in a bear regime, RSI rallies toward 60 are treated as a potential selling or shorting opportunity, provided the 60 level holds.
- The third is range-shift monitoring: watching the opposite boundary of the currently prevailing range for early warning signs. In a bull range, this means monitoring whether RSI can still rebound convincingly above 60 after a pullback; failure to do so suggests the uptrend is losing strength and a shift toward the bear range of 20 to 60 may be underway.
- The fourth is confirmation over anticipation: because range shifts can occasionally resemble whipsaws, especially in choppy or transitional markets, the method is generally recommended as one input within a broader weight-of-the-evidence approach that also incorporates price structure, moving averages, candlestick confirmation, and divergence analysis, rather than as a standalone mechanical trading system.
- The fifth concerns sideways conditions: when RSI oscillates persistently between roughly 40 and 60 without committing to either range, this is read as a sideways or transitional market, in which trend-following range rules are less reliable and increased caution is warranted.
● 8. Limitations and Critical Considerations
Several caveats accompany the practical use of this framework.
- First, the Cardwell ranges are empirical observations drawn from recurring market behavior rather than fixed mathematical constants; individual securities may respect slightly different boundaries, and some practitioners apply a five-point cushion around the 60 and 40 levels to account for this variability.
- Second, the method depends on an accurate prior classification of the market regime; because that classification itself typically relies on a lagging measure such as a moving average, there is an inherent element of hindsight in confirming which range "should" have applied at a given time, which complicates rigorous backtesting of the strategy in isolation.
- Third, the approach is explicitly presented in the original source material as a component of disciplined trading practice rather than a guaranteed predictive system; Cardwell himself emphasized that range analysis is best combined with patience, a defined trading plan, and other corroborating evidence rather than applied as an automatic buy or sell trigger.
● 9. Conclusion
Andrew Cardwell's regime-based reinterpretation of the RSI represents a meaningful conceptual advance over the traditional static 70/30 framework. By recognizing that the oscillator's effective range migrates predictably with the character of the prevailing trend, and by formalizing this migration into the 40/80 bull range and 20/60 bear range, Cardwell provided technical analysts with a tool that is explicitly sensitive to trend context. The interior 40 and 60 boundaries, in particular, function as accessible early-warning levels for trend continuation or exhaustion, complementing the broader multi-horizon trend-turn sequencing that underlies classical technical trend analysis. As with any technical framework, the range-shift methodology is best deployed as one component of a broader analytical process rather than as an isolated, purely mechanical trading rule.
Cardwell Range Analyze applies the regime-based range rules discussed above, shifting the effective RSI bounds from the standard 30/70 to 40/80 in bull trends and 20/60 in bear trends. The 40 and 60 levels serve as the trend-confirmation boundaries described in Section 3, providing an early indication of a range shift before it is confirmed by price. As with the broader methodology, a failure to clear 60 in an uptrend, or a failure to hold above 40 in a downtrend, should be read as a warning sign within a wider weight-of-evidence approach rather than as an isolated signal.
● References
- Cardwell, A. Using the RSI. Cardwell RSI EDGE, Inc.
- Cardwell RSI EDGE, Inc. Official course materials and commentary.
- GTLackey's RPM. "RSI Bull and Bear Ranges." gtlackey.com/rsi-bull-and-bear-ranges.
- Hayden, J. RSI: The Complete Guide.
⚠️Disclaimer
This article is for educational purposes only and does not constitute financial, investment, or trading advice. All quantitative frameworks discussed are theoretical and carry inherent risks; past performance is never indicative of future results. You are solely responsible for your own investment decisions, risk management, and any financial losses incurred. No content herein guarantees profit or success in real-world market environments. Please consult with a qualified financial advisor before deploying any strategies.

💡 Proprietary indicators. Original research. Built by analysts who trade.
👑 Premium: markittick.com
📢 Free Telegram: t.me/MarkitTick_Updates
👑 Premium: markittick.com
📢 Free Telegram: t.me/MarkitTick_Updates
Penafian
Maklumat dan penerbitan adalah tidak bertujuan, dan tidak membentuk, nasihat atau cadangan kewangan, pelaburan, dagangan atau jenis lain yang diberikan atau disahkan oleh TradingView. Baca lebih dalam Terma Penggunaan.
💡 Proprietary indicators. Original research. Built by analysts who trade.
👑 Premium: markittick.com
📢 Free Telegram: t.me/MarkitTick_Updates
👑 Premium: markittick.com
📢 Free Telegram: t.me/MarkitTick_Updates
Penafian
Maklumat dan penerbitan adalah tidak bertujuan, dan tidak membentuk, nasihat atau cadangan kewangan, pelaburan, dagangan atau jenis lain yang diberikan atau disahkan oleh TradingView. Baca lebih dalam Terma Penggunaan.