
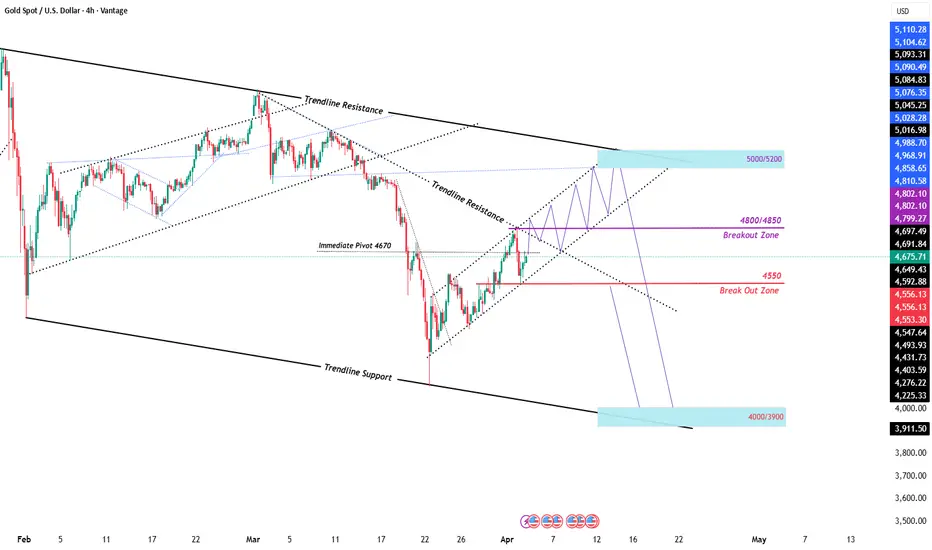
The global gold market enters the trading week of May 6 to May 11, 2026, positioned at a historic inflection point. Driven by a volatile convergence of geopolitical conflict, shifting interest rate expectations, and an unprecedented structural shift in institutional demand, the yellow metal has navigated a period of extreme fluctuations.
Following a swift correction from historical peaks, XAU/USD has entered a stabilization phase, seeking to establish a new consolidation range. As the market digests the fallout from the ongoing conflict in the Middle East and the resulting disruption in global energy supplies, price action has transitioned from a pure momentum play into a high-stakes battle between inflationary pressures and the rising opportunity cost of non-yielding assets.
GOLD MARKET FUNDAMENTALS: GEOPOLITICAL SHOCKS
The primary narrative driving gold prices as the week commences is the persistent military hostilities in the Middle East. The conflict has entered a critical stage where the threat of a full-scale ground invasion and the blockade of the Strait of Hormuz have injected a substantial risk premium into both energy and precious metals.
The Strait of Hormuz and Energy-Driven Inflation:
Disruptions to shipping through the Strait of Hormuz have pushed Brent crude oil above $110 per barrel. This "Hormuz premium" is now a permanent feature of market pricing. While liquidity needs often outweigh safe-haven demand in the early stages of such shocks, the role of gold as a store of wealth tends to reassert itself as trust in traditional debt markets weakens.
Geopolitical Catalyst Overview:
Middle East Conflict: Operation Epic Fury Ongoing (High Volatility / Safe-Haven Demand)
Strait of Hormuz: Partial Blockade (Bullish for Energy and Gold Premium)
U.S. Trade Policy: New Tariff Threats on EU/Canada (Bullish for Diversification Assets)
Iran Deadline: May 6 Negotiation Window (Critical Pivot Point for Oil Prices)
U.S. Credit Rating: Downgraded to Aa1 by Moody's (Long-term Structural Support for Gold)
CENTRAL BANK ACCUMULATION AND DE-DOLLARIZATION
A significant structural floor under gold prices has been established by unprecedented central bank accumulation. While buying slowed slightly in early 2026, the long-term trend remains firmly bullish as nations seek alternatives to the dollar-dominated financial system.
Key Institutional Moves:
Poland (NBP): Added 20 tonnes in February 2026, bringing the total to 570 tonnes.
China (PBOC): Reported its 16th consecutive month of purchases.
Uzbekistan & India: Continued growth in reserves to mitigate financial sanction risks.
TECHNICAL ANALYSIS OF XAU/USD
Technically, gold is navigating a critical "Decision Zone". Following the sharp correction from all-time highs above $5,500, the market is attempting to reclaim broken support levels.
Key Support and Resistance Levels (May 6–11):
Immediate Pivot Point ($4,670–$4,680): Axis for short-term direction. Consolidation above this suggests a base for recovery.
Immediate Supply Zone ($4,720–$4,760): Resistance area. A daily close above $4,760 is required to challenge the 50-day EMA.
Major Structural Resistance ($4,800–$4,850): Confluence of the 50-day EMA and the 61.8% Fibonacci retracement.
Psychological Ceiling ($5,000): Reclaiming this level would invalidate the medium-term bearish outlook.
Critical Decision Zone ($4,630–$4,631): Confluence of the 0.382 Fibonacci level and the rising trendline.
Primary Support Floor ($4,400–$4,500): February lows. A break below $4,400 opens the door for the 200-day EMA near $4,124.
Technical Indicators:
RSI (14): Daily at 54.10 (Neutral / Improving)
MACD (12, 26): 4-Hour near Zero Line (Indecision / Ranging)
EMA (20): Daily $4,735 (Dynamic Resistance)
EMA (50): Daily $4,800 (Major Trend Barrier)
EMA (200): Daily $4,124 (Long-term Value Floor)
THE FEDERAL RESERVE AND ECONOMIC DATA FORECAST
The primary headwind for gold is the rise in real yields and the rapid erosion of rate-cut expectations. With the U.S. economy showing resilience, the "Higher-for-Longer" narrative remains dominant.
Economic Calendar: High-Impact Events (GMT):
May 6 : US ISM Services PMI (Forecast: 55.0)
May 8 : RBNZ Rate Decision (Forecast: 2.25% Hold)
May 8 : FOMC Meeting Minutes
May 10 : US CPI YoY (Forecast: 2.5%)
May 10 : UoM Consumer Sentiment (Forecast: 54.5)
TRADING STRATEGY AND RISK MANAGEMENT
Gold has transitioned into a volatility-driven medium. Traders should expect daily ranges of $150 to $250.
Smart Money Concepts: Institutional order flow indicates liquidity-seeking behavior below March/April lows. Watch for "liquidity sweeps" below $4,600.
Gold-Silver Ratio (GSR): The ratio has compressed to a 15-year low near 59:1, suggesting silver outperformance but potential short-term exhaustion in metals.
Position Sizing: Because the current $4,600+ price level carries a higher notional value, position sizes must be adjusted to keep total risk per trade below 1-2%.
Stop Losses: Utilize the Average True Range (ATR) to set stops. With ATR near $120, tight stops are risky.
FAQ SECTION
Q: Why is gold falling despite the war?
A: Initial stages of conflict often trigger liquidity liquidation. High oil prices fuel inflation, leading the Fed to maintain high rates, which increases the opportunity cost of holding gold.
Q: Best time to trade XAU/USD this week?
A: Volatility peaks during the London/New York overlap (13:00 to 17:00 GMT). Friday's US CPI release will be critical.
Q: Is the gold bull run over for 2026?
A: Major institutions remain bullish long-term, with targets ranging from $5,400 to $6,300 by year-end, citing central bank buying.
Disclaimer: This analysis is for educational purposes only and does not constitute financial advice.
Following a swift correction from historical peaks, XAU/USD has entered a stabilization phase, seeking to establish a new consolidation range. As the market digests the fallout from the ongoing conflict in the Middle East and the resulting disruption in global energy supplies, price action has transitioned from a pure momentum play into a high-stakes battle between inflationary pressures and the rising opportunity cost of non-yielding assets.
GOLD MARKET FUNDAMENTALS: GEOPOLITICAL SHOCKS
The primary narrative driving gold prices as the week commences is the persistent military hostilities in the Middle East. The conflict has entered a critical stage where the threat of a full-scale ground invasion and the blockade of the Strait of Hormuz have injected a substantial risk premium into both energy and precious metals.
The Strait of Hormuz and Energy-Driven Inflation:
Disruptions to shipping through the Strait of Hormuz have pushed Brent crude oil above $110 per barrel. This "Hormuz premium" is now a permanent feature of market pricing. While liquidity needs often outweigh safe-haven demand in the early stages of such shocks, the role of gold as a store of wealth tends to reassert itself as trust in traditional debt markets weakens.
Geopolitical Catalyst Overview:
Middle East Conflict: Operation Epic Fury Ongoing (High Volatility / Safe-Haven Demand)
Strait of Hormuz: Partial Blockade (Bullish for Energy and Gold Premium)
U.S. Trade Policy: New Tariff Threats on EU/Canada (Bullish for Diversification Assets)
Iran Deadline: May 6 Negotiation Window (Critical Pivot Point for Oil Prices)
U.S. Credit Rating: Downgraded to Aa1 by Moody's (Long-term Structural Support for Gold)
CENTRAL BANK ACCUMULATION AND DE-DOLLARIZATION
A significant structural floor under gold prices has been established by unprecedented central bank accumulation. While buying slowed slightly in early 2026, the long-term trend remains firmly bullish as nations seek alternatives to the dollar-dominated financial system.
Key Institutional Moves:
Poland (NBP): Added 20 tonnes in February 2026, bringing the total to 570 tonnes.
China (PBOC): Reported its 16th consecutive month of purchases.
Uzbekistan & India: Continued growth in reserves to mitigate financial sanction risks.
TECHNICAL ANALYSIS OF XAU/USD
Technically, gold is navigating a critical "Decision Zone". Following the sharp correction from all-time highs above $5,500, the market is attempting to reclaim broken support levels.
Key Support and Resistance Levels (May 6–11):
Immediate Pivot Point ($4,670–$4,680): Axis for short-term direction. Consolidation above this suggests a base for recovery.
Immediate Supply Zone ($4,720–$4,760): Resistance area. A daily close above $4,760 is required to challenge the 50-day EMA.
Major Structural Resistance ($4,800–$4,850): Confluence of the 50-day EMA and the 61.8% Fibonacci retracement.
Psychological Ceiling ($5,000): Reclaiming this level would invalidate the medium-term bearish outlook.
Critical Decision Zone ($4,630–$4,631): Confluence of the 0.382 Fibonacci level and the rising trendline.
Primary Support Floor ($4,400–$4,500): February lows. A break below $4,400 opens the door for the 200-day EMA near $4,124.
Technical Indicators:
RSI (14): Daily at 54.10 (Neutral / Improving)
MACD (12, 26): 4-Hour near Zero Line (Indecision / Ranging)
EMA (20): Daily $4,735 (Dynamic Resistance)
EMA (50): Daily $4,800 (Major Trend Barrier)
EMA (200): Daily $4,124 (Long-term Value Floor)
THE FEDERAL RESERVE AND ECONOMIC DATA FORECAST
The primary headwind for gold is the rise in real yields and the rapid erosion of rate-cut expectations. With the U.S. economy showing resilience, the "Higher-for-Longer" narrative remains dominant.
Economic Calendar: High-Impact Events (GMT):
May 6 : US ISM Services PMI (Forecast: 55.0)
May 8 : RBNZ Rate Decision (Forecast: 2.25% Hold)
May 8 : FOMC Meeting Minutes
May 10 : US CPI YoY (Forecast: 2.5%)
May 10 : UoM Consumer Sentiment (Forecast: 54.5)
TRADING STRATEGY AND RISK MANAGEMENT
Gold has transitioned into a volatility-driven medium. Traders should expect daily ranges of $150 to $250.
Smart Money Concepts: Institutional order flow indicates liquidity-seeking behavior below March/April lows. Watch for "liquidity sweeps" below $4,600.
Gold-Silver Ratio (GSR): The ratio has compressed to a 15-year low near 59:1, suggesting silver outperformance but potential short-term exhaustion in metals.
Position Sizing: Because the current $4,600+ price level carries a higher notional value, position sizes must be adjusted to keep total risk per trade below 1-2%.
Stop Losses: Utilize the Average True Range (ATR) to set stops. With ATR near $120, tight stops are risky.
FAQ SECTION
Q: Why is gold falling despite the war?
A: Initial stages of conflict often trigger liquidity liquidation. High oil prices fuel inflation, leading the Fed to maintain high rates, which increases the opportunity cost of holding gold.
Q: Best time to trade XAU/USD this week?
A: Volatility peaks during the London/New York overlap (13:00 to 17:00 GMT). Friday's US CPI release will be critical.
Q: Is the gold bull run over for 2026?
A: Major institutions remain bullish long-term, with targets ranging from $5,400 to $6,300 by year-end, citing central bank buying.
Disclaimer: This analysis is for educational purposes only and does not constitute financial advice.

Forex Signals:
Youtube:
youtube.com/channel/UCMRAU6KDZOro-KmFFSKlfYA
Linkedin:
linkedin.com/company/investor-tipster
Website:
investortipster.com/
Youtube:
youtube.com/channel/UCMRAU6KDZOro-KmFFSKlfYA
Linkedin:
linkedin.com/company/investor-tipster
Website:
investortipster.com/
Penerbitan berkaitan
Penafian
Maklumat dan penerbitan adalah tidak bertujuan, dan tidak membentuk, nasihat atau cadangan kewangan, pelaburan, dagangan atau jenis lain yang diberikan atau disahkan oleh TradingView. Baca lebih dalam Terma Penggunaan.
Forex Signals:
Youtube:
youtube.com/channel/UCMRAU6KDZOro-KmFFSKlfYA
Linkedin:
linkedin.com/company/investor-tipster
Website:
investortipster.com/
Youtube:
youtube.com/channel/UCMRAU6KDZOro-KmFFSKlfYA
Linkedin:
linkedin.com/company/investor-tipster
Website:
investortipster.com/
Penerbitan berkaitan
Penafian
Maklumat dan penerbitan adalah tidak bertujuan, dan tidak membentuk, nasihat atau cadangan kewangan, pelaburan, dagangan atau jenis lain yang diberikan atau disahkan oleh TradingView. Baca lebih dalam Terma Penggunaan.