
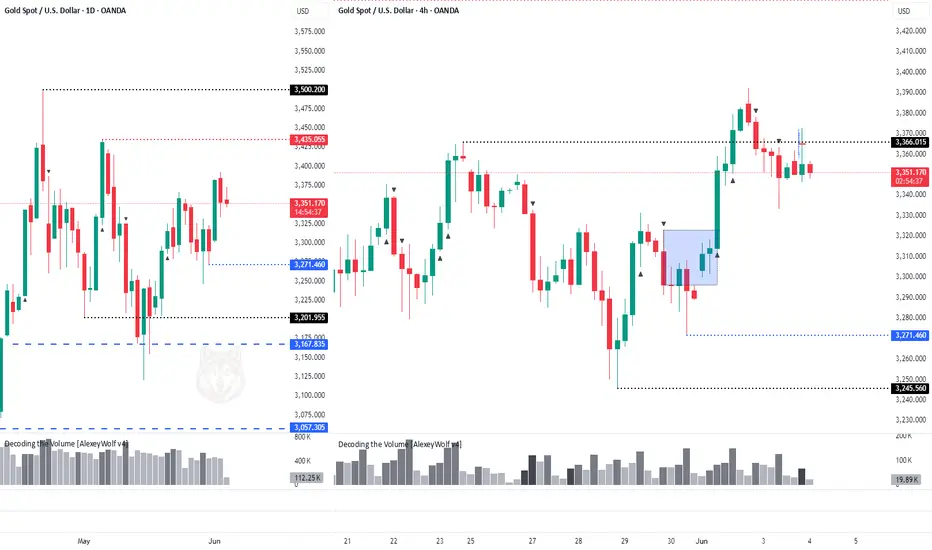
📍 GOLD — Daily & 4H Timeframes
On the daily timeframe, gold is targeting the 3435 level.
On the 4-hour chart, buyers attempted to break out of the sideways range, but the price was pulled back inside.
A second attempt also failed — only the wick extended beyond the range, where the key volume is located.
It’s likely that the price will test the buyer zone again (blue rectangle on the chart), which also contains a price gap.
The boundaries of the sideways ranges are marked with black lines.
This analysis is based on the Initiative Analysis concept (IA).
Wishing you profitable trades!
On the daily timeframe, gold is targeting the 3435 level.
On the 4-hour chart, buyers attempted to break out of the sideways range, but the price was pulled back inside.
A second attempt also failed — only the wick extended beyond the range, where the key volume is located.
It’s likely that the price will test the buyer zone again (blue rectangle on the chart), which also contains a price gap.
The boundaries of the sideways ranges are marked with black lines.
This analysis is based on the Initiative Analysis concept (IA).
Wishing you profitable trades!

Clarity on the Chart. Smart Trading Decisions
Penerbitan berkaitan
Penafian
Maklumat dan penerbitan adalah tidak bertujuan, dan tidak membentuk, nasihat atau cadangan kewangan, pelaburan, dagangan atau jenis lain yang diberikan atau disahkan oleh TradingView. Baca lebih dalam Terma Penggunaan.
Clarity on the Chart. Smart Trading Decisions
Penerbitan berkaitan
Penafian
Maklumat dan penerbitan adalah tidak bertujuan, dan tidak membentuk, nasihat atau cadangan kewangan, pelaburan, dagangan atau jenis lain yang diberikan atau disahkan oleh TradingView. Baca lebih dalam Terma Penggunaan.