
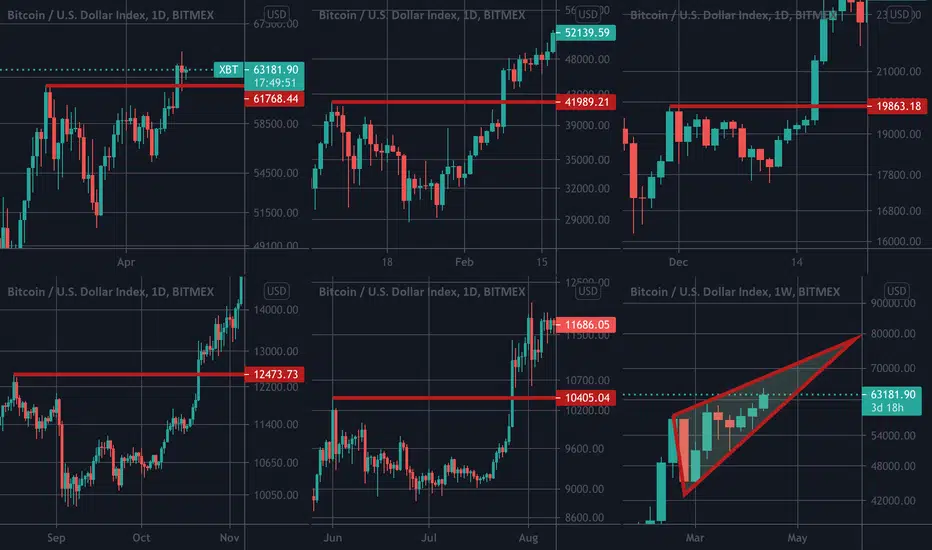
The first 5 charts are daily charts and show Bitcoin’s reactions to its resistance levels during this Bullish rally.
The last chart is weekly chart of Bitcoin.
There is a difference between the most recent and the previous four times that Bitcoin passed its resistance, can you identify what is that
Share your answer in the comments
The last chart is weekly chart of Bitcoin.
There is a difference between the most recent and the previous four times that Bitcoin passed its resistance, can you identify what is that
Share your answer in the comments

Use the following link to access trading ideas: patreon.com/SniperTraderStocks?utm_medium=unknown&utm_source=join_link&utm_campaign=creatorshare_creator&utm_content=copyLink
Penafian
Maklumat dan penerbitan adalah tidak bertujuan, dan tidak membentuk, nasihat atau cadangan kewangan, pelaburan, dagangan atau jenis lain yang diberikan atau disahkan oleh TradingView. Baca lebih dalam Terma Penggunaan.
Use the following link to access trading ideas: patreon.com/SniperTraderStocks?utm_medium=unknown&utm_source=join_link&utm_campaign=creatorshare_creator&utm_content=copyLink
Penafian
Maklumat dan penerbitan adalah tidak bertujuan, dan tidak membentuk, nasihat atau cadangan kewangan, pelaburan, dagangan atau jenis lain yang diberikan atau disahkan oleh TradingView. Baca lebih dalam Terma Penggunaan.