XMRUSDT H1
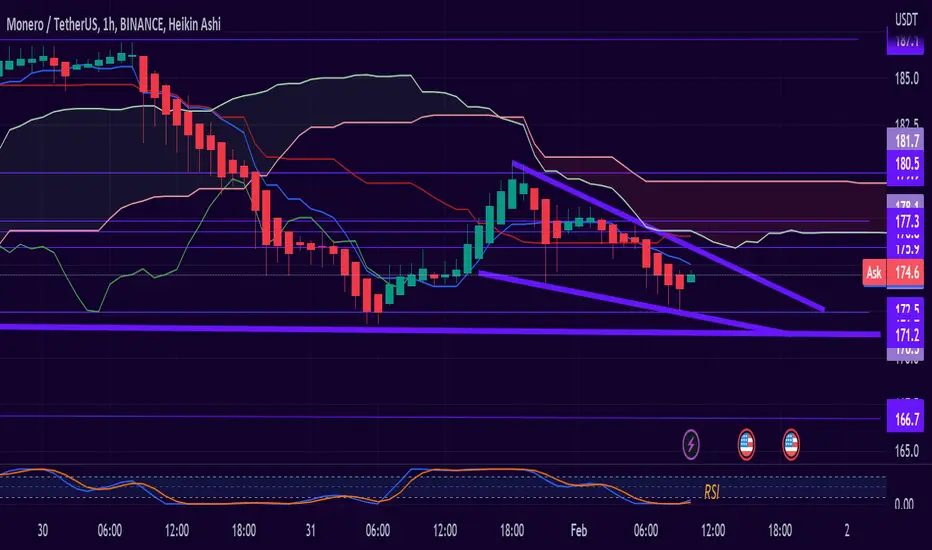
Looking at the short-term H1 chart, my overall bias for XMRUSDT is bearish due to the current price being below the Ichimoku cloud, indicating a bear market.
As the RSI shows the exhaustion of selling forces , a limit buy entry at 171.22 where it would make a triple bottom and the support of the lower line of the Keltner Channel .
Key support levels: 171.2 / 166.7
Main Resistance Levels: 175.9 / 179.9
✅RSI: Exhaustion of selling forces.
✅MM200: At the height of 177.3
As the RSI shows the exhaustion of selling forces , a limit buy entry at 171.22 where it would make a triple bottom and the support of the lower line of the Keltner Channel .
Key support levels: 171.2 / 166.7
Main Resistance Levels: 175.9 / 179.9
✅RSI: Exhaustion of selling forces.
✅MM200: At the height of 177.3

Renato Ulianov | Market Analysis & Trading
YouTube: youtube.com/@TradewithRenatoUlianov
Disclaimer: All content is for educational and informational purposes only and does not constitute financial advice.
YouTube: youtube.com/@TradewithRenatoUlianov
Disclaimer: All content is for educational and informational purposes only and does not constitute financial advice.
Penafian
Maklumat dan penerbitan adalah tidak bertujuan, dan tidak membentuk, nasihat atau cadangan kewangan, pelaburan, dagangan atau jenis lain yang diberikan atau disahkan oleh TradingView. Baca lebih dalam Terma Penggunaan.
Renato Ulianov | Market Analysis & Trading
YouTube: youtube.com/@TradewithRenatoUlianov
Disclaimer: All content is for educational and informational purposes only and does not constitute financial advice.
YouTube: youtube.com/@TradewithRenatoUlianov
Disclaimer: All content is for educational and informational purposes only and does not constitute financial advice.
Penafian
Maklumat dan penerbitan adalah tidak bertujuan, dan tidak membentuk, nasihat atau cadangan kewangan, pelaburan, dagangan atau jenis lain yang diberikan atau disahkan oleh TradingView. Baca lebih dalam Terma Penggunaan.