
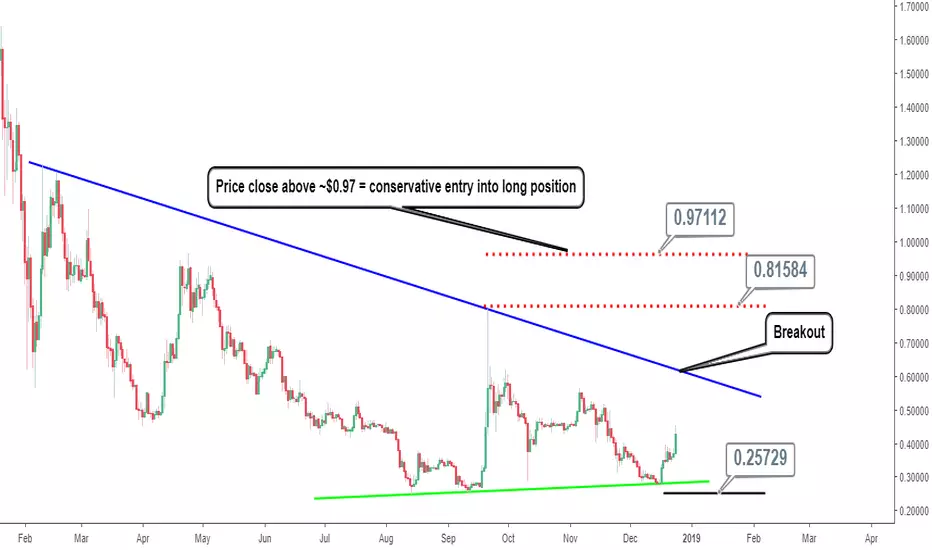
XRP analysis (Ripple) for today is carried out on the 6 hour timeframe. A bearish trendline is used to help determine the overhead resistance in Ripple coupled with horizontal resistance between ~$0.82 and $0.97.
Support is indicated by the green line, with ~$0.25 also used to indicate the level to watch as price closing below $0.25 would present a bearish bias.
Alternatively, price closing above the bearish trendline and also above the upper limit of resistance ($0.97) can be used as a conservative price entry into a long (buy) position.
Less conservative options in executing a long (buy) strategy would seek to enter the trade in anticipation of eventual breakout above resistance as mentioned above.
Support is indicated by the green line, with ~$0.25 also used to indicate the level to watch as price closing below $0.25 would present a bearish bias.
Alternatively, price closing above the bearish trendline and also above the upper limit of resistance ($0.97) can be used as a conservative price entry into a long (buy) position.
Less conservative options in executing a long (buy) strategy would seek to enter the trade in anticipation of eventual breakout above resistance as mentioned above.

Penerbitan berkaitan
Penafian
Maklumat dan penerbitan adalah tidak bertujuan, dan tidak membentuk, nasihat atau cadangan kewangan, pelaburan, dagangan atau jenis lain yang diberikan atau disahkan oleh TradingView. Baca lebih dalam Terma Penggunaan.
Penerbitan berkaitan
Penafian
Maklumat dan penerbitan adalah tidak bertujuan, dan tidak membentuk, nasihat atau cadangan kewangan, pelaburan, dagangan atau jenis lain yang diberikan atau disahkan oleh TradingView. Baca lebih dalam Terma Penggunaan.