
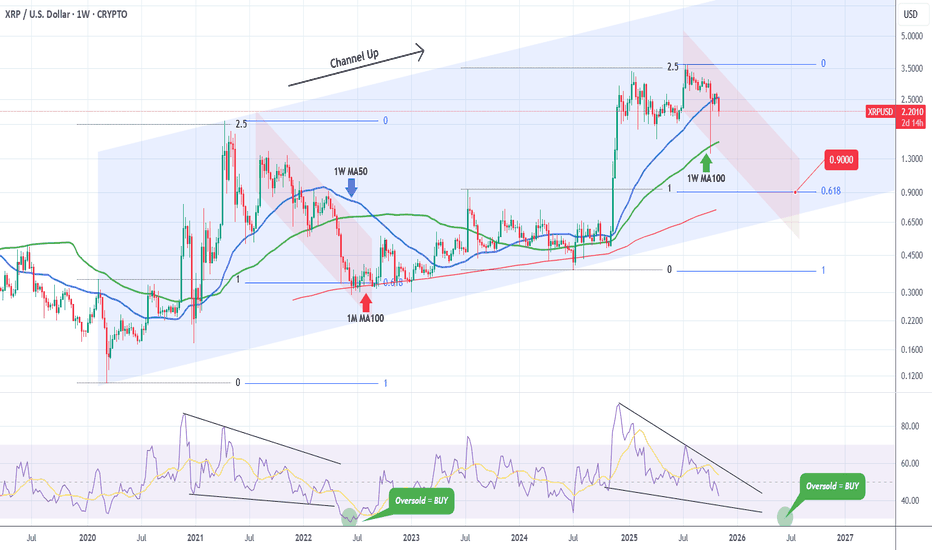
More than 4 months ago (November 07 2025, see chart below), we gave a massive long-term Sell Signal on XRP (XRPUSD), after it got rejected on its 1W MA50 (blue trend-line):
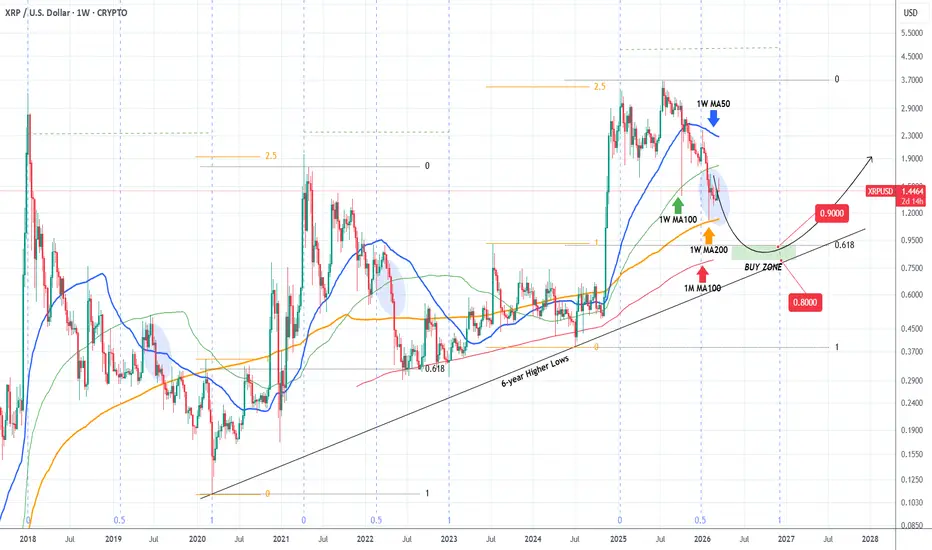
The price action responded immediately and has been on a strong decline ever since. It is time to revisit this and put it into a greater context comparing the current Bear Cycle to the previous two.
Following February's rebound on the 1W MA200 (orange trend-line) and the inability of XRP to recover its 1W MA100 (green trend-line), we see strong similarities with February - March 2022 and March - May 2019. In both cases this price action was past the middle of each Bear Cycle, so technically we should be in a similar position now as well (past the 0.5 Time Fibonacci level).
A break below the 1W MA200 would signal the final drop and bottom formation upon touching the 1M MA100 (red trend-line). Given the 6-year Higher Lows trend-line just below it, we can formulate a realistic Buy Zone technically.
Our $0.9000 Target still stands, as it is on the 0.618 Fibonacci retracement level and the trajectory of the 1M MA100, which is the combined Support on which the June 13 2022 bottom was formed. Taking into account also the 6-year Higher Lows trend-line, we can estimate a total Buy Zone for a long-term buy within 0.9000 - 0.8000.
---
** Please LIKE 👍, FOLLOW ✅, SHARE 🙌 and COMMENT ✍ if you enjoy this idea! Also share your ideas and charts in the comments section below! This is best way to keep it relevant, support us, keep the content here free and allow the idea to reach as many people as possible. **
---
💸💸💸💸💸💸
👇 👇 👇 👇 👇 👇
The price action responded immediately and has been on a strong decline ever since. It is time to revisit this and put it into a greater context comparing the current Bear Cycle to the previous two.
Following February's rebound on the 1W MA200 (orange trend-line) and the inability of XRP to recover its 1W MA100 (green trend-line), we see strong similarities with February - March 2022 and March - May 2019. In both cases this price action was past the middle of each Bear Cycle, so technically we should be in a similar position now as well (past the 0.5 Time Fibonacci level).
A break below the 1W MA200 would signal the final drop and bottom formation upon touching the 1M MA100 (red trend-line). Given the 6-year Higher Lows trend-line just below it, we can formulate a realistic Buy Zone technically.
Our $0.9000 Target still stands, as it is on the 0.618 Fibonacci retracement level and the trajectory of the 1M MA100, which is the combined Support on which the June 13 2022 bottom was formed. Taking into account also the 6-year Higher Lows trend-line, we can estimate a total Buy Zone for a long-term buy within 0.9000 - 0.8000.
---
** Please LIKE 👍, FOLLOW ✅, SHARE 🙌 and COMMENT ✍ if you enjoy this idea! Also share your ideas and charts in the comments section below! This is best way to keep it relevant, support us, keep the content here free and allow the idea to reach as many people as possible. **
---
💸💸💸💸💸💸
👇 👇 👇 👇 👇 👇

I trade Crypto, Forex, Indices & Commodities on PrimeXBT — all from one account with TradingView charts 👉 tradingshot.short.gy/PrimeXBT
I also use TradeNation for fixed spreads & zero commission 👉 tradingshot.short.gy/Tradenation
I also use TradeNation for fixed spreads & zero commission 👉 tradingshot.short.gy/Tradenation
Penafian
Maklumat dan penerbitan adalah tidak bertujuan, dan tidak membentuk, nasihat atau cadangan kewangan, pelaburan, dagangan atau jenis lain yang diberikan atau disahkan oleh TradingView. Baca lebih dalam Terma Penggunaan.
I trade Crypto, Forex, Indices & Commodities on PrimeXBT — all from one account with TradingView charts 👉 tradingshot.short.gy/PrimeXBT
I also use TradeNation for fixed spreads & zero commission 👉 tradingshot.short.gy/Tradenation
I also use TradeNation for fixed spreads & zero commission 👉 tradingshot.short.gy/Tradenation
Penafian
Maklumat dan penerbitan adalah tidak bertujuan, dan tidak membentuk, nasihat atau cadangan kewangan, pelaburan, dagangan atau jenis lain yang diberikan atau disahkan oleh TradingView. Baca lebih dalam Terma Penggunaan.