
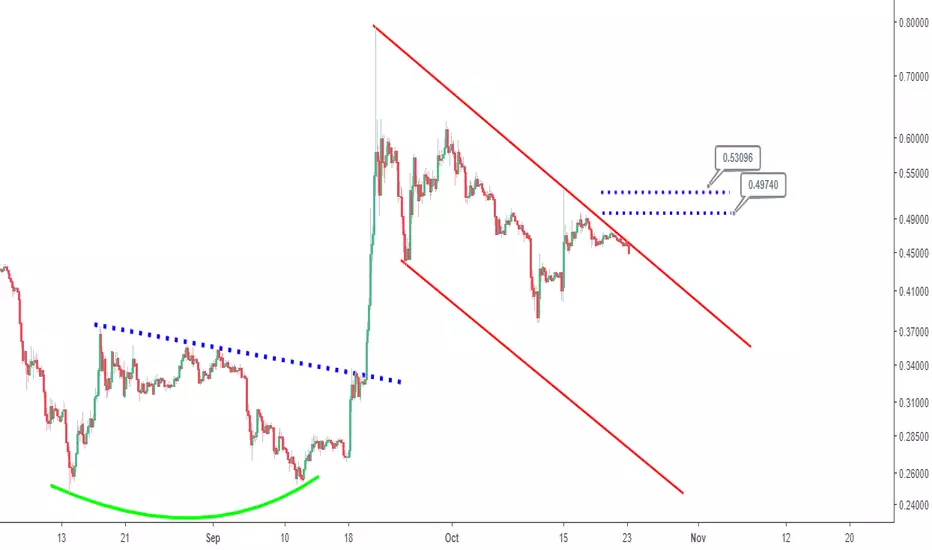
August 14, 2018 to September 20, 2018 marked the formation of a confirmed double bottom chart pattern in Ripple (XRP). Price action after confirmation reached a high of ~$0.79 before the current retracement that is captured with a bearish channel considered to be tentative.
Price action breaking to the upside of the bear channel and also above resistance as indicated by the horizontal blue lines does argue for a bullish bias for Ripple (XRP).
Price action breaking to the upside of the bear channel and also above resistance as indicated by the horizontal blue lines does argue for a bullish bias for Ripple (XRP).

Penerbitan berkaitan
Penafian
Maklumat dan penerbitan adalah tidak bertujuan, dan tidak membentuk, nasihat atau cadangan kewangan, pelaburan, dagangan atau jenis lain yang diberikan atau disahkan oleh TradingView. Baca lebih dalam Terma Penggunaan.
Penerbitan berkaitan
Penafian
Maklumat dan penerbitan adalah tidak bertujuan, dan tidak membentuk, nasihat atau cadangan kewangan, pelaburan, dagangan atau jenis lain yang diberikan atau disahkan oleh TradingView. Baca lebih dalam Terma Penggunaan.