
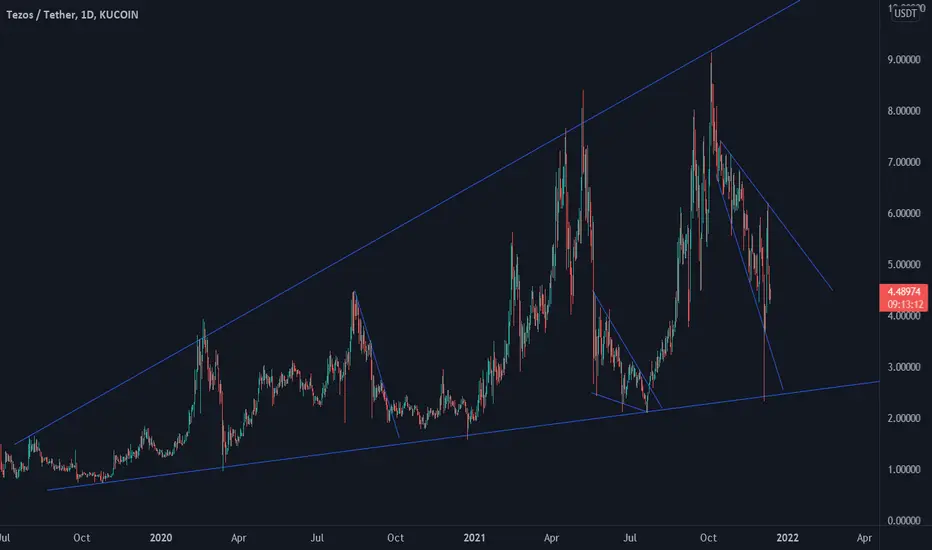
If zoom out, we can see that the Tezos is moving in an inverted wedge/triangle pattern. There are support and resistance lines/areas which when the price reaches, will bounce off it. Currently, XTZ is moving down, also in an inverted wedge/triangle. The best area to buy is when the price reaches the area near the bottom of the pattern.

Penafian
Maklumat dan penerbitan adalah tidak bertujuan, dan tidak membentuk, nasihat atau cadangan kewangan, pelaburan, dagangan atau jenis lain yang diberikan atau disahkan oleh TradingView. Baca lebih dalam Terma Penggunaan.
Penafian
Maklumat dan penerbitan adalah tidak bertujuan, dan tidak membentuk, nasihat atau cadangan kewangan, pelaburan, dagangan atau jenis lain yang diberikan atau disahkan oleh TradingView. Baca lebih dalam Terma Penggunaan.