Panjang
YFIBTC - Possible Bullish Pattern
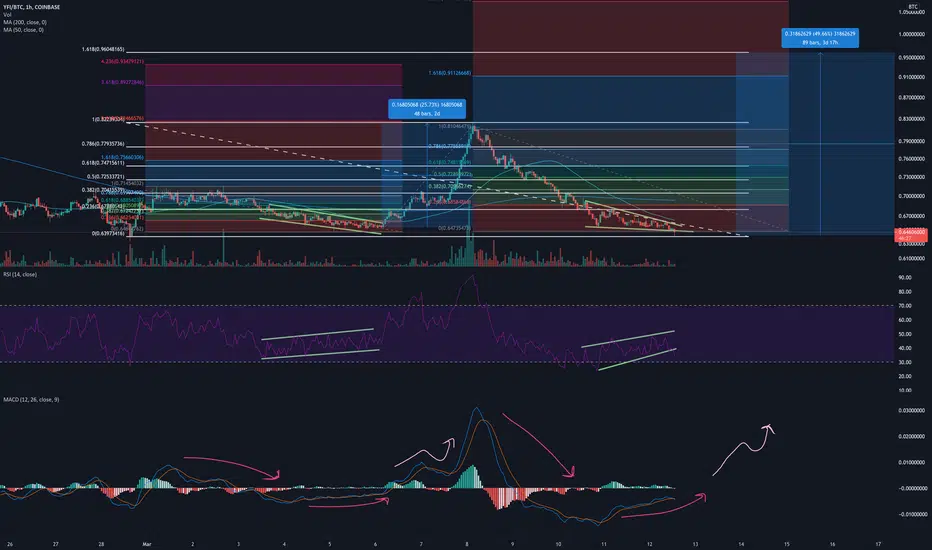
The YFI/BTC(Yearn.Finance) is forming a bullish RSI divergence like it did a few days ago before its ~25% increase which indicates a trend reversal.
For safer short term trading, wait until the 50MA & the 200MA make a golden cross on the 30minute/1hour chart.
If YFI breaks below the bottom fib level, I will expect further downward movement. I will be watching the fib levels for support and resistance if YFI begins to trend upwards.
For safer short term trading, wait until the 50MA & the 200MA make a golden cross on the 30minute/1hour chart.
If YFI breaks below the bottom fib level, I will expect further downward movement. I will be watching the fib levels for support and resistance if YFI begins to trend upwards.
Nota
YFI has dropped roughly 6% breaking below the bottom fib level.If YFI drops below .582 btc which is the bottom fib level on the 12H chart drawn from the low in beginning of January, I will expect even more downside

Penafian
Maklumat dan penerbitan adalah tidak bertujuan, dan tidak membentuk, nasihat atau cadangan kewangan, pelaburan, dagangan atau jenis lain yang diberikan atau disahkan oleh TradingView. Baca lebih dalam Terma Penggunaan.
Penafian
Maklumat dan penerbitan adalah tidak bertujuan, dan tidak membentuk, nasihat atau cadangan kewangan, pelaburan, dagangan atau jenis lain yang diberikan atau disahkan oleh TradingView. Baca lebih dalam Terma Penggunaan.