
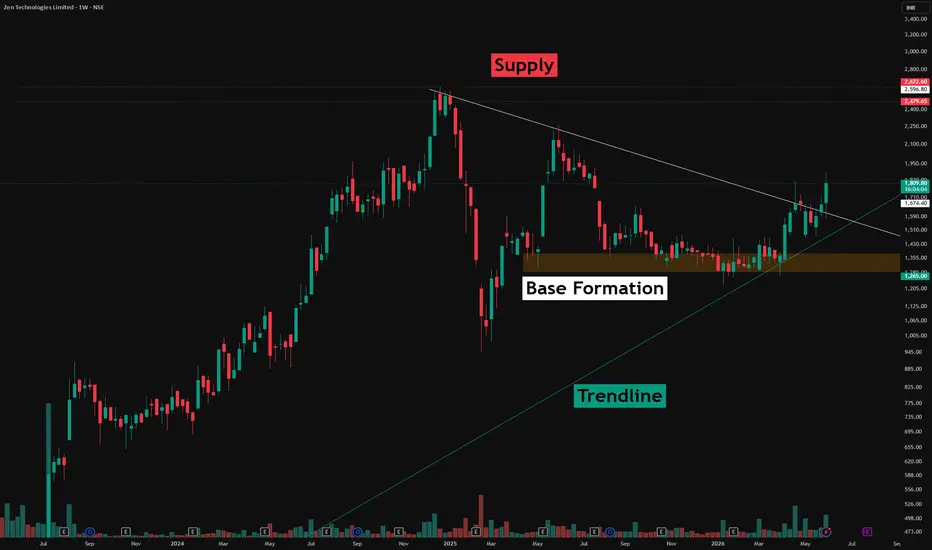
Technical Terms Explained :
Descending Triangle A bearish chart pattern normally but when made after a one sided move it can be a great overall bullish pattern, formed when price makes a series of lower highs while support remains flat. This means buyers are weakening — they can't push price higher each time, but sellers are consistently stepping in at lower levels unless the CT of this Pattern gets a Break which changes the Wind.
Counter Trendline
A trendline drawn against the dominant move. In a downtrend, it connects the lower highs within a pullback or consolidation. It doesn't mean price is reversing — it simply marks the boundary of the corrective move. A break above it may signal a short-term bounce; a rejection confirms the original trend is continuing.
Base Formation ( Extremely Important stuff )
A tight, compressed consolidation zone where price moves sideways with minimal range. It represents a balance between buyers and sellers before one side dominates. Bases are significant because the longer price compresses, the more energy builds — leading to a sharp expansion move once price breaks out or breaks down.
Higher Timeframe Trendline
A trendline drawn on a larger timeframe (daily, weekly) connecting major swing highs or lows.
Higher Timeframe Supply Zone
A price area on a larger timeframe where significant selling previously occurred
⚠️ Disclaimer
This post is purely for educational purposes and is intended to showcase technical analysis concepts only. It does not constitute financial advice, a trade recommendation, or a price forecast. Always do your own research.
Descending Triangle A bearish chart pattern normally but when made after a one sided move it can be a great overall bullish pattern, formed when price makes a series of lower highs while support remains flat. This means buyers are weakening — they can't push price higher each time, but sellers are consistently stepping in at lower levels unless the CT of this Pattern gets a Break which changes the Wind.
Counter Trendline
A trendline drawn against the dominant move. In a downtrend, it connects the lower highs within a pullback or consolidation. It doesn't mean price is reversing — it simply marks the boundary of the corrective move. A break above it may signal a short-term bounce; a rejection confirms the original trend is continuing.
Base Formation ( Extremely Important stuff )
A tight, compressed consolidation zone where price moves sideways with minimal range. It represents a balance between buyers and sellers before one side dominates. Bases are significant because the longer price compresses, the more energy builds — leading to a sharp expansion move once price breaks out or breaks down.
Higher Timeframe Trendline
A trendline drawn on a larger timeframe (daily, weekly) connecting major swing highs or lows.
Higher Timeframe Supply Zone
A price area on a larger timeframe where significant selling previously occurred
⚠️ Disclaimer
This post is purely for educational purposes and is intended to showcase technical analysis concepts only. It does not constitute financial advice, a trade recommendation, or a price forecast. Always do your own research.

📊Swing & positional research with Buy, Sell & Hold recommendations
Contact for NOVEMBER SLOTS
📞WhatsApp ( Pro ): wa.me/919455664601
📢Free Picks on Telegram ( Join ) : t.me/hashtaghammer
Apoorv Dubey|SEBI RA INH000030287
Contact for NOVEMBER SLOTS
📞WhatsApp ( Pro ): wa.me/919455664601
📢Free Picks on Telegram ( Join ) : t.me/hashtaghammer
Apoorv Dubey|SEBI RA INH000030287
Penerbitan berkaitan
Penafian
Maklumat dan penerbitan adalah tidak bertujuan, dan tidak membentuk, nasihat atau cadangan kewangan, pelaburan, dagangan atau jenis lain yang diberikan atau disahkan oleh TradingView. Baca lebih dalam Terma Penggunaan.
📊Swing & positional research with Buy, Sell & Hold recommendations
Contact for NOVEMBER SLOTS
📞WhatsApp ( Pro ): wa.me/919455664601
📢Free Picks on Telegram ( Join ) : t.me/hashtaghammer
Apoorv Dubey|SEBI RA INH000030287
Contact for NOVEMBER SLOTS
📞WhatsApp ( Pro ): wa.me/919455664601
📢Free Picks on Telegram ( Join ) : t.me/hashtaghammer
Apoorv Dubey|SEBI RA INH000030287
Penerbitan berkaitan
Penafian
Maklumat dan penerbitan adalah tidak bertujuan, dan tidak membentuk, nasihat atau cadangan kewangan, pelaburan, dagangan atau jenis lain yang diberikan atau disahkan oleh TradingView. Baca lebih dalam Terma Penggunaan.