
Hello friends
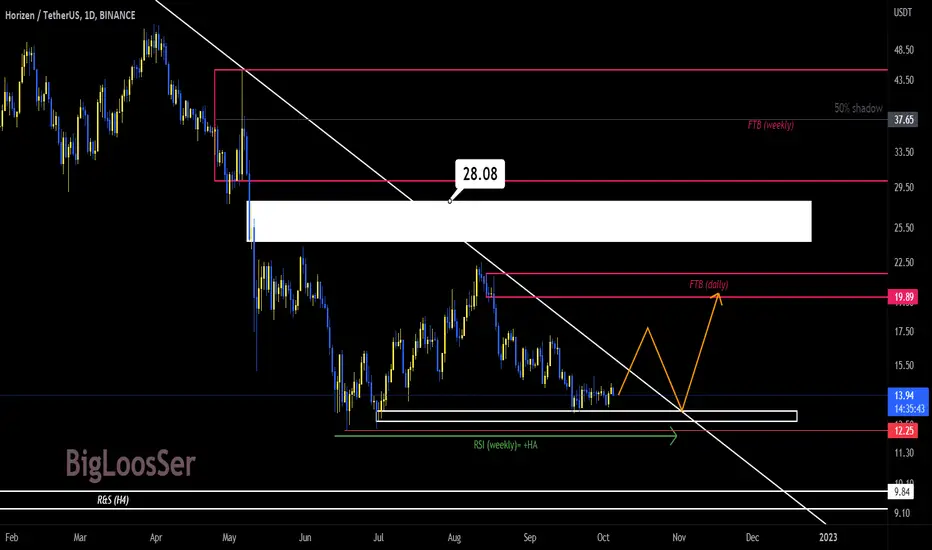
The positive divergence of the RSA in the weekly chart and the downward trend line , which the price is just below, is an interesting combination, isn't it!?
If the $12.25 range is maintained in the current trend and the upward trend is placed above the $17.2 price range, the long-term downward trend line will be broken upwards.
In this case, we can expect an increasing trend in the medium term.
What do you think?

Penafian
Maklumat dan penerbitan adalah tidak bertujuan, dan tidak membentuk, nasihat atau cadangan kewangan, pelaburan, dagangan atau jenis lain yang diberikan atau disahkan oleh TradingView. Baca lebih dalam Terma Penggunaan.
Penafian
Maklumat dan penerbitan adalah tidak bertujuan, dan tidak membentuk, nasihat atau cadangan kewangan, pelaburan, dagangan atau jenis lain yang diberikan atau disahkan oleh TradingView. Baca lebih dalam Terma Penggunaan.