
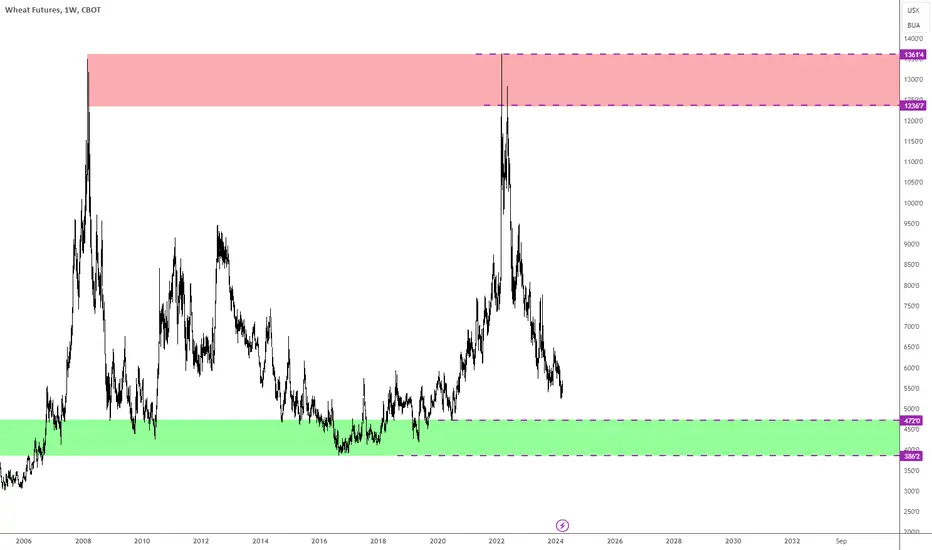
Supply and demand zones for Wheat on the weekly chart.
Once you enter the zone, look for the lower timeframe reversal patterns, extended waves, classic trendline breaks, etc.
Drop down to the Daily for refined supply and demand zones.
Drop down to 1 hour chart for the current trend after you see the reversal pattern.
Once you enter the zone, look for the lower timeframe reversal patterns, extended waves, classic trendline breaks, etc.
Drop down to the Daily for refined supply and demand zones.
Drop down to 1 hour chart for the current trend after you see the reversal pattern.

Chris Juliano
Penafian
Maklumat dan penerbitan adalah tidak bertujuan, dan tidak membentuk, nasihat atau cadangan kewangan, pelaburan, dagangan atau jenis lain yang diberikan atau disahkan oleh TradingView. Baca lebih dalam Terma Penggunaan.
Chris Juliano
Penafian
Maklumat dan penerbitan adalah tidak bertujuan, dan tidak membentuk, nasihat atau cadangan kewangan, pelaburan, dagangan atau jenis lain yang diberikan atau disahkan oleh TradingView. Baca lebih dalam Terma Penggunaan.