Long
Long
GOLD - Consolidation. The trend may continueICMARKETS:XAUUSD is correcting from its 15-week highs on Tuesday amid a stronger dollar and heightened geopolitical tensions. The local bullish trend remains intact
The Dollar Index is forming a counter-trend correction, which is putting some short-term pressure on gold. The correction appears temporary, supported by easing rate expectations and technical support. The market is waiting for new signals
Drivers:
Downside: conflict escalation, higher oil prices and a stronger dollar, hawkish Fed signals.
Upside: weaker dollar, easing geopolitical risks, lower yields, dip-buying
Resistance levels: 4,680, 4,700, 4,720
Support levels: 4,630, 4,600
The local trend remains bullish. Gold is undergoing a corrective phase to build momentum ahead of a potential continuation higher.
Areas of interest: 4,720–4,775
Consolidation above 4,630 could become a technical catalyst for further upside toward the stated targets
Best regards,
R. Linda.  Long
Long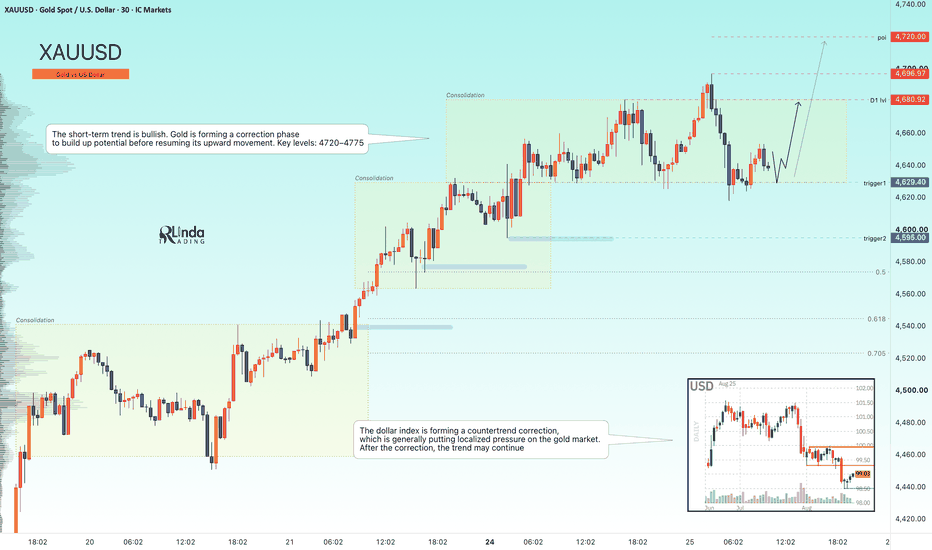
ETHUSDT - Consolidation could trigger further growthBINANCE:ETHUSDT.P remains relatively strong compared to Bitcoin. After a strong rally, the altcoin has entered consolidation near key resistance levels, which is a locally positive setup
Bitcoin is strengthening on the back of recent news and breaking out of its year-long bearish trend. Last week’s session closed favorably, and the lack of a deep correction increases the chances of further upside across the broader market.
After a strong rally and reaching a new high at 2,550, Ethereum has entered a consolidation phase, indicating strong buyer interest in further upside
Resistance levels: 2485, 2550
Support levels: 2423, 2356
Technically, the market could form a local long squeeze around the support zone before continuing higher. However, a breakout and close above 2,485 would open the way for a potential rally toward 2,550–2,620
Best regards,
R. Linda.  Long
Long
GOLD - Local correction before growth ICMARKETS:XAUUSD is making new highs, but toward the end of Friday’s trading session, the market entered a local correction phase amid profit-taking. The market remains in a local bullish phase
The dollar is stagnating again after its sharp decline, with no change in market structure. Technically, the bearish move could continue
Gold is forming a correction within its bullish phase. The current liquidity-hunting phase could soon give way to another bullish impulse.
Next week, the main focus will be on the PCE data and GDP.
Technically, gold is forming a bottom around 4,000 and breaking its local market structure, suggesting a potential return to the broader trend. At the open of the session, gold could continue its local correction before resuming the uptrend.
Areas of interest: 4,770–4,860
Resistance levels: 4630, 4650
Support levels: 4590, 4578, 4563
Locally, the key range is 4,563–4,630. Within the current range, gold is correcting toward the liquidity zone.
A long squeeze around the 4,590–4,580 area could trigger a bounce and a move higher toward 4,650
Best regards,
R. Linda Long 
BITCOIN - Correction before a rally to 83000BINANCE:BTCUSDT.P , amid the current market euphoria and a shift from consolidation to distribution, is testing the 80K resistance area. Locally, there are bullish conditions, but strong resistance lies ahead
The market entered a rally phase following the crypto summit held at the White House. Is Trump once again engaging in pre-election manipulation???
Technically, Bitcoin is breaking out of its year-long bearish trend, with news acting as the main catalyst for the move.
The 67,200–60,000 consolidation phase is coming to an end with relatively strong distribution, while price is heading toward 82,900.
Locally, after the strong rally, Bitcoin has entered a 76K–79.5K consolidation phase. Within the local bullish trend, the market could retest the 76,400–75,700 support zone.
A long squeeze around the support zone could shift the balance of power in favor of buyers, potentially triggering a move toward 82,500
Resistance levels: 79550, 82460
Support levels: 76390, 75770, 73450
A long squeeze of the support zone, followed by a return into the range and consolidation above the key level, could become a technical catalyst for further upside under the current market conditions
Best regards,
R. Linda  Long
Long
 Long
Long
 Long
Long
GOLD - The Hunt for Liquidity Ahead of the Rally ICMARKETS:XAUUSD , within a news-driven distribution phase, is testing the 4,525 D1 level and is bouncing back toward support in search of liquidity
The Dollar Index continues to decline sharply, providing support for gold. However, caution is warranted given the current fundamental and geopolitical backdrop.
Gold’s bullish bias should remain intact unless we see a sharp rise in oil prices or a hawkish shift from the Fed.
The nearest areas of interest and liquidity are 4,480 (4,472)–4,450
Drivers:
Downside: hawkish Fed signals, conflict escalation (which could support the dollar), higher oil prices.
Upside: weaker dollar, lower yields, dip-buying
Resistance levels: 4525, 4541, 4580
Support levels: 4472, 4450, 4435
Technically, before continuing higher toward 4,540–4,580, gold could form a correction toward 4,472–4,450–4,435, targeting liquidity below the current price.
A long squeeze could shift the local balance of power in favor of buyers and trigger further upside
Best regards,
R. Linda Long 
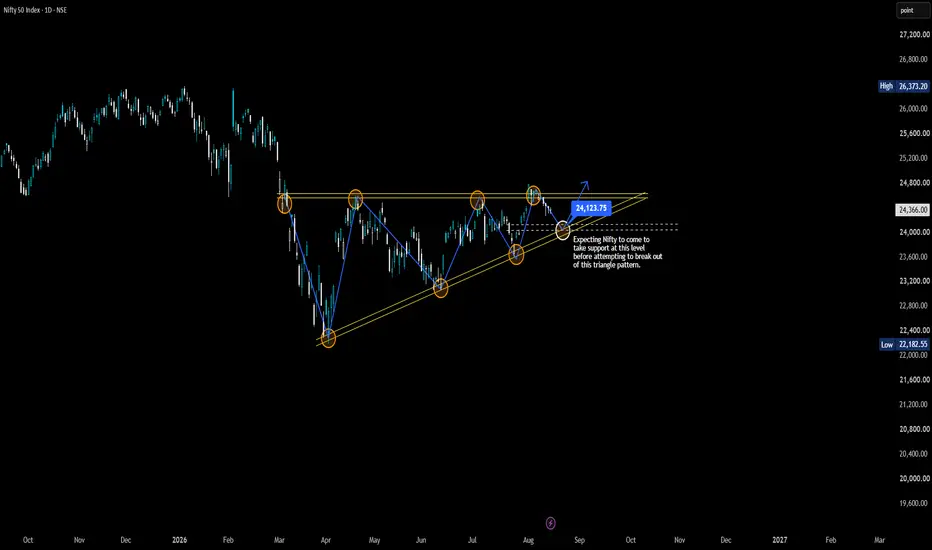
NIFTY - Movement as per previous pattern.Hello traders, let's break down the current daily (1D) chart for NIFTY using pure price action.
I have marked the key levels directly on the chart for easy understanding. As you can see, Nifty has been consolidating within a highly structured ascending triangle pattern. We are seeing a textbook battle between buyers and sellers: resistance is holding firm at the top boundary, while bulls continue to step in at higher lows, signaling underlying strength and accumulation.
What I am watching right now:
The Pullback: Instead of front-running a breakout, I am anticipating a minor corrective move. I am expecting the market to come down towards the white dashed line and the circle marked on the chart before making a decisive move upwards.
The Confluence: This specific area around 24,125 acts as a crucial demand zone, aligning with previous market structure and the ascending support trendline.
The Breakout Attempt: If price action demonstrates strength and rejection of lower prices at this support level, it will set the stage for a high-probability breakout attempt above the upper resistance boundary.
Trade Psychology & Next Steps:
The most important edge a trader can have is patience. Do not anticipate the breakout before it happens. Wait for Nifty to retrace to the marked support zone, and observe the price action there. Look for candlestick confirmation (like a bullish pin bar or engulfing candle) before committing.
Trading this kind of setup is straightforward when you stick to the plan and remove emotions from the equation—mastering the psychology of patience means anybody can trade these setups successfully.
Let me know your thoughts in the comments! Are you waiting to buy the dip at support, or are you expecting a breakdown? HYPEUSDT - A Pullback Before a Bull Run BINANCE:HYPEUSDT.P is forming a local bullish setup. The altcoin is outperforming the broader market, including Bitcoin, and for this reason, the coin has further upside potential
Bitcoin, meanwhile, remains neutral within a consolidation that has been developing for several months as part of the broader global bearish market.
HYPE maintains its global bullish trend, within which a 53.0–75.0 trading range is forming. The range is relatively wide, and the bounce from support opens up a medium-term trading opportunity. There is still room for further upside, and we are waiting for the bulls to step in more aggressively
Resistance levels: 60.47, 63.0
Support levels: 58.0, 57.09
The market is confirming its local bullish structure. However, after reaching a new high, a counter-trend correction is developing toward the imbalance zone.
An upside breakout followed by consolidation above 58.0 could provide the catalyst for the continuation of the uptrend toward 60–63
Best regards,
R. Linda Long 
Fully funded pipeline in advanced stages. 30% short interest?INTRODUCTION:
- The company has three compounds in the pipeline, two of which are slated for commercial launch by 2028, with the third one soon to follow.
- The business if fully funded towards those goals as of the writing of this idea.
- The two compounds in Phase 3 studies are already showing significant promise, as reflected in the EU and US regulatory designations: Regenerative Medicine Advanced Therapy (RMAT), Orphan Drug Designation (ODD), Orphan Medicinal Product Designation (OMPD), Advance Therapy Medicinal Products (ATMP), Rare Pediatric Disease Designation (RPDD).
And yet the company is shorted 30% of its float . Roughly 100 million shares are shorted. This appears to be a recipe for disaster (for the shorts), especially since the chart appears to be notably bullish.
THE TA:
The above 3D chart illustrates the main bullish arguments in this idea.
1. The company is out of a multi-year downtrend which started with the IPO in 2015.
2. Following a massive spike in 2021, price action entered a three-year period of distribution (rotated teal rectangle).
3. The distribution period ended with a breakout of the multi-year downtrend.
4. The breakout from the multi-year downtrend precipitated a period of uptrending consolidation under the $1.75 resistance.
5. The $1.75 resistance together with higher lows that have been printing since November 2023 create an ascending triangle, a classic bullish continuation pattern.
6. Price action has exited a local corrective downtrend (light red diagonal channel) just as a double bottom and a potential new higher low have printed on the following:
- top of market structure (the horizontal support/resistance channel); three times tested now,
- the golden ratio; following a retracement from a previous local high (the 0.382 lies squarely on top of market structure),
- the bottom of a 3D Gaussian Channel
- the 200-day SMA (which happens to run exactly along the bottom of the 3D Gaussian Channel).
7. RSI and MFI are both out of local corrective downtrends (MFI with backtest).
SUPPLEMENTAL TA:
1. On the 6D chart, price action confirms support on GC mean just as the 50-day and 200-day SMAs are gearing up for a life-cross, first time ever:
2. On the 13D chart, price action prints a successful test of support on past horizontal resistance (and a potential new local higher low) just as the 13D GC flips from red to green for the first time ever:
MFI and RSI on this timeframe have both printed higher lows. Stochastic RSI is gearing up for a cross up 20 which should be a favorable event like most of the past ones, given all the other bullish signals.
SUMMARY:
This is the kind of bio I'm looking for these days (having learned to do so the hard way). Although not as overwhelmingly bullish as some ( NASDAQ:ALT for example) it's got all the important green lights on: a bullish chart, funded for at least 2 years, and a pipeline with very promising compounds in Phase 3 of trials. This should minimize the risk of downside from the typical troubles that plague startup bios: failed trials and no money.
Dashed horizontal lines in light blue denote major levels of support/resistance. If or when the $1.75 resistance is conquered, there is very little to stop the action before $7, and then $14. Should that break too, I wouldn't push my luck past $30. I'm not using a stop-loss.
***
Written by hand.
I'm not a pro.
I write these down for myself so triple-check it all if you think of jumping in after me. Or just triple-check it anyway to rub an error in my face, if I've made one. I'll own it, and hopefully learn from it.
 Long
Long
GOLD - The Hunt for Liquidity Ahead of the Distribution ICMARKETS:XAUUSD maintains its local bullish trend and is entering a consolidation phase, within which a clear trigger is forming. A breakout of this trigger could strengthen the continuation of the upward move
The Dollar Index remains stagnant and is testing support within a downward impulse. Further dollar weakness could become a technical driver for gold upside. The key area to watch is 4,390–4,370.
The correction in gold appears temporary. The fundamental backdrop — including a weaker dollar and expectations of lower Fed rates — continues to support the metal. Key events this week include the FOMC minutes on Wednesday, as well as U.S. housing and industrial production data.
Technically, dip-buying remains the more likely scenario.
Drivers:
Downside: higher oil prices and yields, stronger dollar, geopolitical uncertainty.
Upside: weaker dollar, lower rate expectations, dip-buying
Resistance levels: 4,435, 4,450, 4,500
Support levels: 4,388, 4,371, 4,313
Gold maintains its local bullish trend. The market is confirming resistance at 4,435, but is forming a correction ahead of a potential breakout, with a possible liquidity hunt as the objective.
A bounce from the 4,370–4,388 zone could trigger a breakout above 4,435 and open the way for further upside toward 4,480–4,500
Best regards,
R. Linda Long 
GOLD - The local uptrend continuesFX:XAUUSD is bouncing off the 4,313 support level of the trading range formed within the local bullish trend. The situation remains challenging, but the market still has room for further upside
The dollar remains stagnant but continues to look weak. A decline in the Dollar Index could support further upside and the ongoing local bullish trend in gold.
The fundamental and geopolitical backdrop remains unstable.
Globally, gold remains in a bearish trend.
Locally, the market is in a bullish distribution phase, with a 4,313–4,435 range forming within it.
Gold is currently correcting within the range ahead of a potential move higher.
There are not many major events scheduled for the coming week. Attention will be focused on the FOMC meeting, initial jobless claims, and PMI data
Resistance level: 4,435
Support levels: 4,356, 4,313
A long squeeze around the local 4,356 support zone could shift the balance of power in favor of buyers and trigger a continuation of the local uptrend toward the upper boundary of the trading range
Best regards,
R. Linda Long 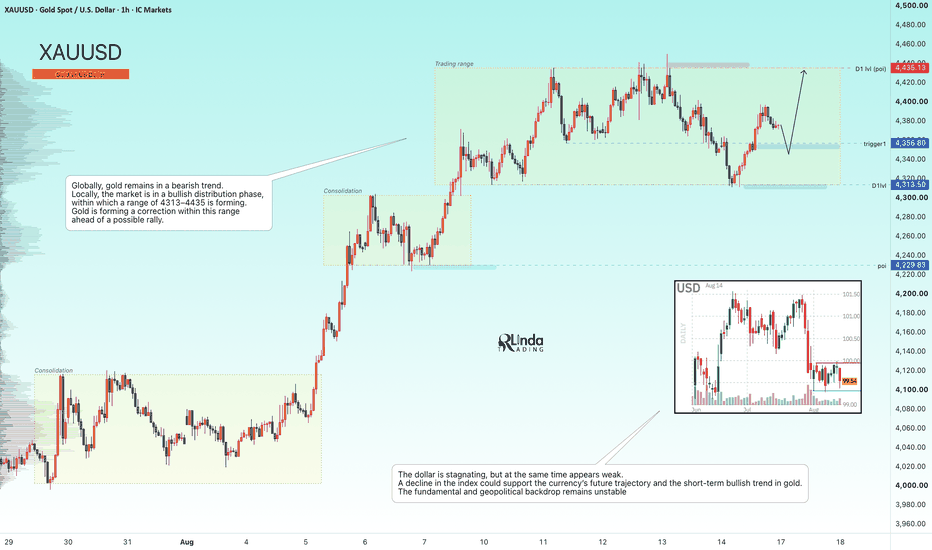
GOLD - The Hunt for Liquidity Ahead of a Rally ICMARKETS:XAUUSD is testing the 4,313 support level as part of a correction. Against the backdrop of a stagnant Dollar Index, the market still has room for further upside
The Dollar Index remains stagnant, but an unstable fundamental and geopolitical backdrop is putting pressure on the dollar and providing support for gold.
Price is correcting after the recent rally, but the fundamental backdrop — including easing rate expectations and geopolitical risks — remains favorable. Buyers are expected to step in on dips.
The key event will be the University of Michigan’s consumer sentiment and inflation expectations data, due later on Friday.
Drivers:
Downside: conflict escalation, rising yields, stronger dollar.
Upside: dip-buying, weaker dollar, easing geopolitical risks
Resistance levels: 4,356, 4,435
Support levels: 4,313, 4,300
Gold maintains its local bullish trend. Within the counter-trend correction, the market is retesting the key liquidity zone at 4,313–4,300 and is bouncing off support.
A close above 4,356 could strengthen the bullish momentum
Best regards,
R. Linda Long 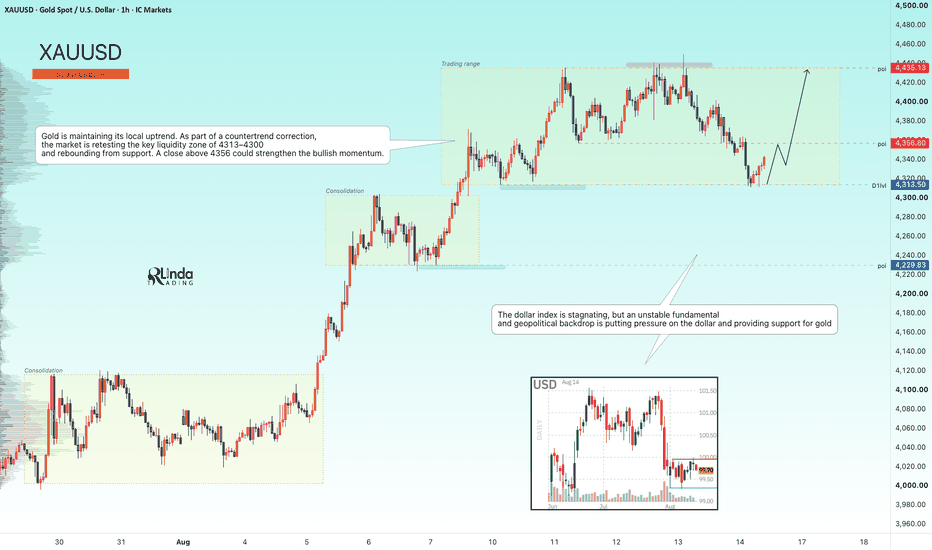
GOLD - The news could trigger a long squeezeICMARKETS:XAUUSD is consolidating within the 4355–4435 range, while the U.S. dollar remains largely stagnant ahead of the upcoming CPI data. Until the release, the market may remain trapped inside the current range while preparing for a potential liquidity manipulation
The U.S. Dollar Index is also consolidating as traders wait for the CPI report. Gold has stalled ahead of this key inflation data, and the initial reaction to CPI could be short-lived as geopolitical risks remain elevated.
A weaker-than-expected CPI could open the door to new highs, while hotter inflation data could trigger a corrective move. The market is waiting for a clear catalyst.
Bullish drivers: Weaker CPI, A weaker U.S. dollar, Lower expectations for further rate hikes, Geopolitical de-escalation
Bearish drivers: Hotter-than-expected CPI, Hawkish Fed rhetoric, A stronger U.S. dollar, Geopolitical escalation
Gold remains in a bullish phase, but news-driven volatility could create a liquidity sweep / long squeeze before the next directional move
Resistance levels: 4435, 4481
Support levels: 4356, 4313, 4302
Gold remains in a bullish phase. However, news-driven volatility could create a liquidity sweep / long squeeze before the next continuation move.
The key zones to watch are 4350 and 4313. A false breakdown of either level, followed by consolidation back above it, could become the technical catalyst for another bullish impulse.
Best regards,
R. Linda Long 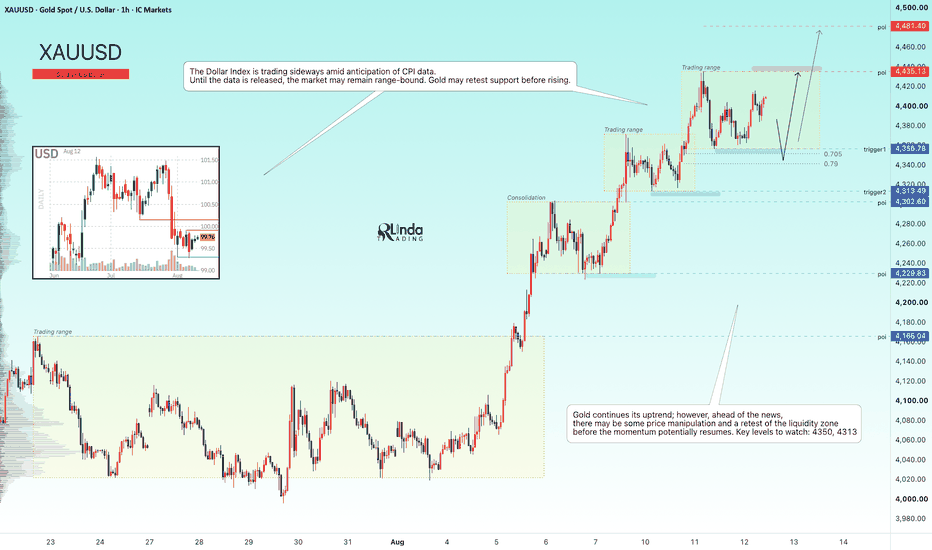
 Long
Long
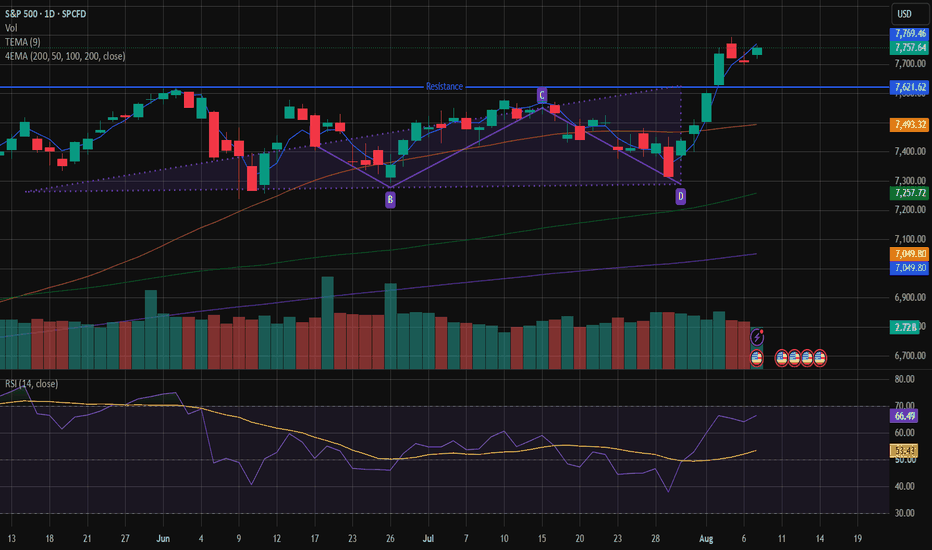
S&P 500: Jobs fell, market rose, triangle held!This video is an update on the S&P 500 trade setup that I put out on 7 August 2026, the day of the release of the July jobs report. The economy lost a shocking -23,000 jobs, the first negative jobs print in this cycle and contrary to expectations of +80,000 jobs, and the S&P 500 went on to close the session near record highs at 7,757. In this video, I discuss precisely how bad news turned good news for the stock market and how the decline in the Fed rate hike probability from 57% to 43.9% led to a 1.3% gain in the Nasdaq and an even stronger run for the semiconductor ETF to +7% on the week. Also discussed is how the ascending triangle breakout at 7,620 held even as the markets saw one of the worst data prints of the year. We discuss the updated trailing stop, the targets that are now achievable, and one statistic from the job report 921,000 temporary layoffs;that you need to watch out for in September.  Long
Long
GOLD - Local bullish sentiment. NFP coming upFollowing a strong rally, ICMARKETS:XAUUSD has entered a consolidation phase, signaling the potential for further upside if buyers can successfully defend the 4300 level.
The U.S. Dollar Index has broken its bullish structure, although the broader fundamental backdrop remains mixed. Geopolitical uncertainty persists, while the Federal Reserve continues to maintain a hawkish stance.
After the recent advance, gold is consolidating and building a liquidity pool around the 4242–4229 zone, which market makers may test before another move higher. There is also a possibility that this could become gold's strongest weekly performance since January.
The next major catalyst will be the U.S. Non-Farm Payrolls (NFP) report. A weaker-than-expected labor market reading could fuel another rally, while stronger data may restore downside pressure. Market participants will also continue to monitor developments in the Middle East and U.S.–Iran negotiations.
Bullish drivers: Weaker-than-expected NFP, A weaker U.S. dollar, Lower interest rate expectations, Progress in geopolitical negotiations
Bearish drivers: Strong NFP data, Hawkish Federal Reserve rhetoric, A stronger U.S. dollar, Escalation of geopolitical tensions
Resistance levels: 4300, 4330, 4370
Support levels: 4242, 4229, 4200
From a technical perspective (setting aside the unpredictability of news events), gold still has room to extend its rally.
Two primary scenarios:
A long squeeze into the 4242–4229 support zone could restore bullish momentum.
A breakout and sustained close above 4300 could also become the technical catalyst for another leg higher.
Best regards,
R. Linda Long 
 Long
Long
SP500: The triangle broke, records are falling here Is the tradeIt took only four trading days for the S&P 500 index to do something quite extraordinary. An unprecedented rally of $3.7 trillion backed by corporate earnings and breaking oil prices lifted the index to an all-time new record of 7,776.68, marking its second record close of two months after hitting the psychological barrier at 7,620 on June 2. In addition, the Dow climbed above 54,000 on Tuesday, a level not witnessed in its entire history. The S&P 500 is up 20.58% from a year ago and up 3.3% so far in August, while the Nasdaq rose by nearly 5% within two trading days.The catalyst chain that led to this move is precisely the kind of thing that drives a bull market;not one isolated piece of news but a series of them, There is just one piece of news left before this bull market can go to the next level and it is today’s job numbers, in light of June’s disastrous performance with non-farm payroll employment growing just 57,000.
The price shows a breakout scenario which has actually been forming over a much longer period than the 4 day advance implies. The breakout pattern that has become apparent here is an ascending triangle formation which has broken to the upside, characterized by a horizontal resistance level around the June highs at 7,620 and a series of higher lows which have been formed throughout July in a tightening price range leading to its eventual breakout. This breakout occurred on Tuesday when there was a clear gap above resistance, trading on a volume level of 2.92 billion shares;institutional participation not the kind of retail euphoria that is typical of a bounce.The 4EMA pattern, which includes 20 EMA at 7,174 and 50 EMA at 6,999, sharply sloping upwards from left to right, provides the necessary layers of dynamic support for this trend being in a positive momentum. The 200 EMA is sitting at 6,863; it is the structural support which has not been really threatened since the April's liberation shock, and the distance between it and the current price level, 850 points, clearly indicates how much upside there has been in the market. Finally, RSI is at 64.17; it is the most informative indicator on this chart. The value of RSI is higher than its signal line of 52.05, and the difference of 12 points indicates the strength of buying pressure that is still below the overbought area of 70 points..In a market that is posting 45% earnings growth YoY and the geopolitical tailwind fading in the rearview mirror, the fact that RSI has not yet reached 70 means that this move still has more to do before we need to be concerned with exhaustion in the move. The MACD is not present in its usual form in this particular chart, but the price action and the EMA configuration reinforce the message conveyed by the indicator that the trend has accelerated, the EMAs are bullish and the ascending triangle breakout is the prevailing technical picture.
Trade recommendation
Direction : Long
Entry horizon : 7,620 – 7,700
Primary target : 7,776
Secondary target : 8,000
Stop loss : Daily close below 7,488
Risk note : July NFP jobs report lands this morning
Technical scenarios
Bull case: Employment strength validates the breakout ;8,000 next: Should July NFP exceed the 175,000 consensus, it effectively exposes June's 57,000 catastrophe as a transitory outlier rather than a structural decay of the labor market. This outcome would provide the fundamental backbone for the ascending triangle breakout, with the former 7,620 ceiling establishing itself as rock-solid support. Technically, we would anticipate the RSI breaching the 70 threshold for the first time since the summer peak, while price action stabilizes above the 7,776 record before launching toward the 8,000 psychological milestone. A confluence of catalysts led by 45% earnings growth and cooling oil prices grants this rally what Bespoke Investment Group defines as "longer legs," turning August into a historic outlier for equities fueled by the AI supercycle.
Base case: In-line payrolls support consolidation above resistance: A print landing near consensus would likely maintain the status quo, avoiding both recessionary panic and fears of renewed Federal Reserve hawkishness. In this scenario, the S&P 500 would likely digest its record high via a disciplined retracement toward the 7,620–7,700 breakout zone;a region where former resistance must now prove its mettle as dynamic support. This would allow the RSI to cool from its current 64 reading toward 58, permitting the TEMA 9 to converge with price within the established ascending triangle framework. For traders sidelined during Tuesday's massive gap, a successful retest of this zone on a closing basis represents the highest-quality entry signal available in current chart analysis.
Bear case: Labor market miss revives recessionary fears ;stop discipline is critical: A second consecutive shock, specifically a print falling below 100,000, would suggest that June's weakness was the onset of a genuine deterioration, potentially leaving the Fed hamstrung despite current rate levels. Such a fundamental shift would immediately challenge the integrity of the ascending triangle breakout, putting the TEMA 9 at 7,444 under intense scrutiny. A daily close beneath 7,488 would confirm that the $3.7 trillion surge was merely a short covering squeeze rather than a sustainable trend resumption. However, until such a violation occurs, the technical framework remains dominant;anchored by significant volume, a bullish EMA alignment, and the most robust earnings performance the index has produced in recent memory.
Long 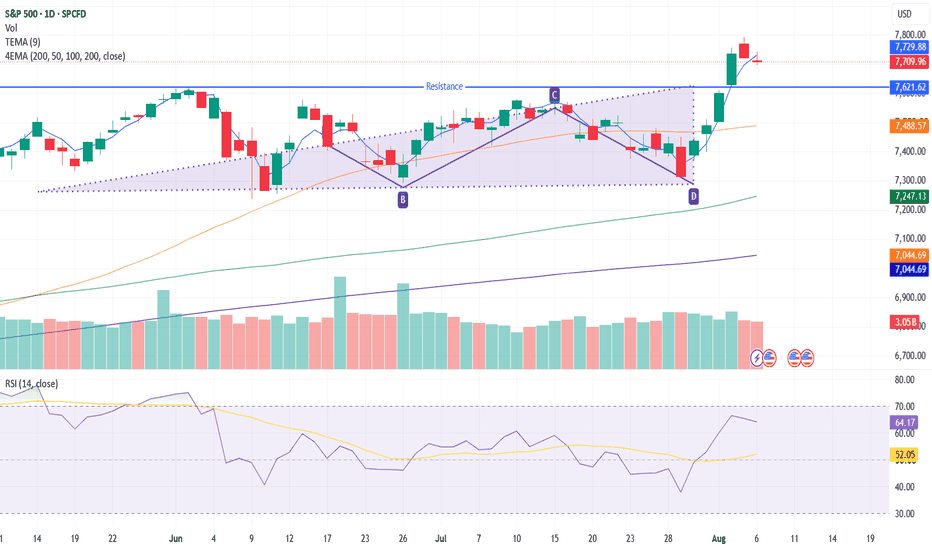
ETHUSDT - Ready for Continued GrowthBINANCE:ETHUSDT is consolidating above 1898 following a distribution phase. From a technical perspective, the daily structure remains constructive, with ETH showing relative strength compared to Bitcoin, which increases the probability of further upside
Bitcoin is gradually recovering and approaching the key 65,150 trigger level. A breakout above this zone could provide additional support for the broader crypto market.
Against this backdrop, Ethereum has broken out of its local bearish corrective structure and entered a new bullish phase. Buyers are actively defending the 1898.5 support zone, keeping the door open for a continuation toward the 1936–1967 resistance area. At the moment, ETH continues to outperform Bitcoin
Resistance levels: 1936, 1967
Support levels: 1898, 1885
A retest of the nearest support zone remains possible. A long squeeze (liquidity sweep) around this area could become the technical catalyst for another bullish impulse toward the stated upside targets
Best regards,
R. Linda Long