ETH/USD SENDS CLEAR BEARISH SIGNALS|SHORT
ETH/USD SIGNAL
Trade Direction: short
Entry Level: 2,634.09
Target Level: 2,340.23
Stop Loss: 2,829.57
RISK PROFILE
Risk level: medium
Suggested risk: 1%
Timeframe: 1D
Disclosure: I am part of Trade Nation's Influencer program and receive a monthly fee for using their TradingView charts in my analysis.
✅LIKE AND COMMENT MY IDEAS✅
Bearish Patterns
EUR/CAD BEARS ARE GAINING STRENGTH|SHORT
Hello, Friends!
EUR/CAD is making a bullish rebound on the 4H TF and is nearing the resistance line above while we are generally bearish biased on the pair due to our previous 1W candle analysis, thus making a trend-following short a good option for us with the target being the 1.604 level.
Disclosure: I am part of Trade Nation's Influencer program and receive a monthly fee for using their TradingView charts in my analysis.
✅LIKE AND COMMENT MY IDEAS✅
EUR/JPY SELLERS WILL DOMINATE THE MARKET|SHORT
Hello, Friends!
It makes sense for us to go short on EUR/JPY right now from the resistance line above with the target of 178.916 because of the confluence of the two strong factors which are the general downtrend on the previous 1W candle and the overbought situation on the lower TF determined by it’s proximity to the upper BB band.
Disclosure: I am part of Trade Nation's Influencer program and receive a monthly fee for using their TradingView charts in my analysis.
✅LIKE AND COMMENT MY IDEAS✅
USD/JPY H1: Bearish Confirmation Below 156.049USD/JPY has experienced a sharp rejection after testing the 157.947 resistance area, suggesting that the recent upward move may be losing momentum. The pair is now approaching an important H1 confirmation zone between 156.241 and 156.049.
The fundamental backdrop is becoming more supportive for the Japanese yen. Expectations surrounding the Bank of Japan’s policy direction, together with upcoming central-bank communication, may increase volatility and strengthen demand for the yen. However, technical confirmation remains essential before treating the current decline as a sustained bearish move.
Key technical levels:
• Near-term resistance: 157.186
• Key bearish invalidation: 157.947
• Bearish confirmation zone: 156.241–156.049
• First downside target: 155.864
• Second downside target: 155.423
• Deeper support zone: 154.961–154.655
• Final visible support: 154.257
Bearish scenario:
A decisive H1 close below 156.049 would confirm that sellers are gaining control and could open the way toward 155.864, followed by 155.423. If bearish momentum continues, the broader 154.961–154.655 support zone may become the next area of interest.
Alternative scenario:
If buyers defend the 156.241–156.049 confirmation zone, USD/JPY may attempt a corrective recovery toward 157.186. A sustained recovery above 157.947 would invalidate the immediate bearish scenario and require a reassessment of the market structure.
For now, this remains a conditional bearish setup rather than an immediate entry signal. Confirmation, upcoming Bank of Japan communication, and disciplined risk management remain essential.
Educational analysis only — not financial advice.
USD/CAD BEARISH BIAS RIGHT NOW| SHORT
Hello, Friends!
Bearish trend on USD/CAD, defined by the red colour of the last week candle combined with the fact the pair is overbought based on the BB upper band proximity, makes me expect a bearish rebound from the resistance line above and a retest of the local target below at 1.393.
Disclosure: I am part of Trade Nation's Influencer program and receive a monthly fee for using their TradingView charts in my analysis.
✅LIKE AND COMMENT MY IDEAS✅
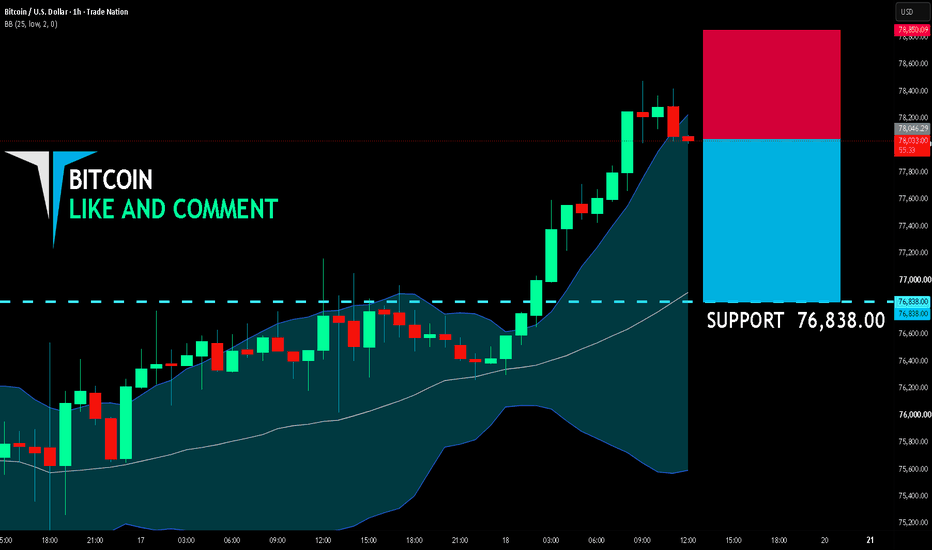
BITCOIN BEST PLACE TO SELL FROM|SHORT
BITCOIN SIGNAL
Trade Direction: short
Entry Level: 78,046.29
Target Level: 76,838.00
Stop Loss: 78,850.09
RISK PROFILE
Risk level: medium
Suggested risk: 1%
Timeframe: 1h
Disclosure: I am part of Trade Nation's Influencer program and receive a monthly fee for using their TradingView charts in my analysis.
✅LIKE AND COMMENT MY IDEAS✅
USDJPY – Strong Intersection AheadUSDJPY remains overall bearish, trading within the falling red channel.
Price is now approaching a strong technical intersection formed by the upper bound of the falling channel and the blue supply zone around the 158.50–159.00 area.
As long as this intersection holds, we will be looking for trend-following sell setups, with the broader bearish structure remaining intact.
A clear break above both the supply zone and the upper trendline would invalidate this bearish scenario.
📌 The trend is bearish. Now we wait for the right location.
⚠️ Disclaimer: This analysis is for educational purposes only and does not constitute financial advice. Always manage your risk and wait for proper confirmation before entering a trade.
📚 Stick to your trading plan regarding entries, risk, and management.
Good luck! 🍀
All Strategies Are Good; If Managed Properly!
~Richard Nasr
USD/CAD SHORT FROM RESISTANCE
USD/CAD SIGNAL
Trade Direction: short
Entry Level: 1.399
Target Level: 1.397
Stop Loss: 1.400
RISK PROFILE
Risk level: medium
Suggested risk: 1%
Timeframe: 1h
Disclosure: I am part of Trade Nation's Influencer program and receive a monthly fee for using their TradingView charts in my analysis.
✅LIKE AND COMMENT MY IDEAS✅
GBP/USD H1: Bearish Continuation if 1.33397 BreaksGBP/USD remains under clear bearish pressure on the H1 timeframe following the latest Bank of England decision.
The Bank Rate was maintained at 3.75%. Despite the relatively hawkish vote split, the pound experienced a sharp sell-off against the US dollar.
Technical structure:
• The H1 chart continues to form lower highs and lower lows.
• Price remains below the key resistance levels.
• Near-term resistance is located at 1.33709.
• The main bearish invalidation level is 1.34047.
• Higher H1 resistance levels are located at 1.34655 and 1.34915.
• Key support is located at 1.33397.
Primary bearish scenario:
A confirmed H1 candle close below 1.33397, followed by a failed retest of this level as resistance, would support further bearish continuation.
Alternative scenario:
Before moving lower, price may recover toward 1.33709. A clear bearish rejection from this level would preserve the downside structure.
Invalidation:
A sustained H1 recovery above 1.34047 would invalidate the immediate bearish continuation scenario and open the way toward the higher resistance levels.
This is a conditional market scenario, not an immediate trade signal. Confirmation and disciplined risk management remain essential.
Educational analysis only — not financial advice.
EUR/USD H1: Bearish Confirmation Below 1.14817This publication is a follow-up and post-analysis of my previous EUR/USD H1 idea.
The original scenario anticipated a possible bearish rejection from the 1.15060–1.15250 resistance zone. Price did not reach that zone, so the original setup was not triggered.
Instead, a lower local H1 resistance area formed around 1.14930–1.14980. Price rejected this area and an H1 candle subsequently closed below 1.14817, confirming the alternative bearish continuation scenario.
Key levels:
• Local H1 resistance: 1.14930–1.14980
• Bearish confirmation: H1 close below 1.14817
• First downside level: 1.14678
• Second downside level: 1.14518
• Alternative-scenario invalidation: sustained H1 recovery above 1.14980
This is a retrospective case study documenting how the market structure developed after the original publication. It is not a new entry signal or individual financial advice.
GOLD SENDS CLEAR BEARISH SIGNALS|SHORT
GOLD SIGNAL
Trade Direction: long
Entry Level: 4,314.32
Target Level: 4,234.37
Stop Loss: 4,367.55
RISK PROFILE
Risk level: medium
Suggested risk: 1%
Timeframe: 1h
Disclosure: I am part of Trade Nation's Influencer program and receive a monthly fee for using their TradingView charts in my analysis.
✅LIKE AND COMMENT MY IDEAS✅
USDCHF – Major Weekly Resistance AheadUSDCHF has been recovering within the rising red channel, but price is now approaching a particularly important area.
The key zone is the intersection of:
The upper bound of the rising red channel
A major weekly resistance zone
This resistance has played an important role historically, making the current intersection an interesting area to watch for sellers.
As long as this intersection holds, we will be looking for short setups, targeting a correction toward the lower bound of the red channel.
📌 The closer price gets to resistance, the more interesting the setup becomes — but confirmation comes first.
⚠️ Disclaimer: This analysis is for educational purposes only and does not constitute financial advice. Always manage your risk and wait for proper confirmation before entering a trade.
📚 Stick to your trading plan regarding entries, risk, and management.
Good luck! 🍀
All Strategies Are Good; If Managed Properly!
~Richard Nasr
CHF/JPY BEARS ARE GAINING STRENGTH|SHORT
Hello, Friends!
CHF/JPY pair is trading in a local uptrend which we know by looking at the previous 1W candle which is green. On the 4H timeframe the pair is going up too. The pair is overbought because the price is close to the upper band of the BB indicator. So we are looking to sell the pair with the upper BB line acting as resistance. The next target is 187.885 area.
Disclosure: I am part of Trade Nation's Influencer program and receive a monthly fee for using their TradingView charts in my analysis.
✅LIKE AND COMMENT MY IDEAS✅
EURUSD is Nearing a Strong Resistance Area.Hey Traders, in today's trading session we are monitoring EURUSD for a selling opportunity around 1.15500 zone, EURUSD is trading in a downtrend and currently is in a correction phase in which it is approaching the trend at 1.15500 support and resistance area.
Trade safe, Joe.
GBPUSDGBP/USD Setup Breakdown
⚬ Market Alignment: Clear bearish bias. Strong lower highs and lower lows across the 1H timeframe, completely aligned with the broader descending channel.
⚬ Structural Break: Price cleanly breached key horizontal support at 1.34692, confirming downside momentum.
⚬ Execution Plan: Looking for a pullback into 1.34692 (now turned resistance). Waiting for exhaustion wicks or lower timeframe rejection before triggering shorts.
⚬ Target: 1.34270 baseline for a clean ~42 pip drop
GBP/NZD SENDS CLEAR BEARISH SIGNALS|SHORT
Hello, Friends!
We are going short on the GBP/NZD with the target of 2.314 level, because the pair is overbought and will soon hit the resistance line above. We deduced the overbought condition from the price being near to the upper BB band. However, we should use low risk here because the 1W TF is green and gives us a counter-signal.
Disclosure: I am part of Trade Nation's Influencer program and receive a monthly fee for using their TradingView charts in my analysis.
✅LIKE AND COMMENT MY IDEAS✅
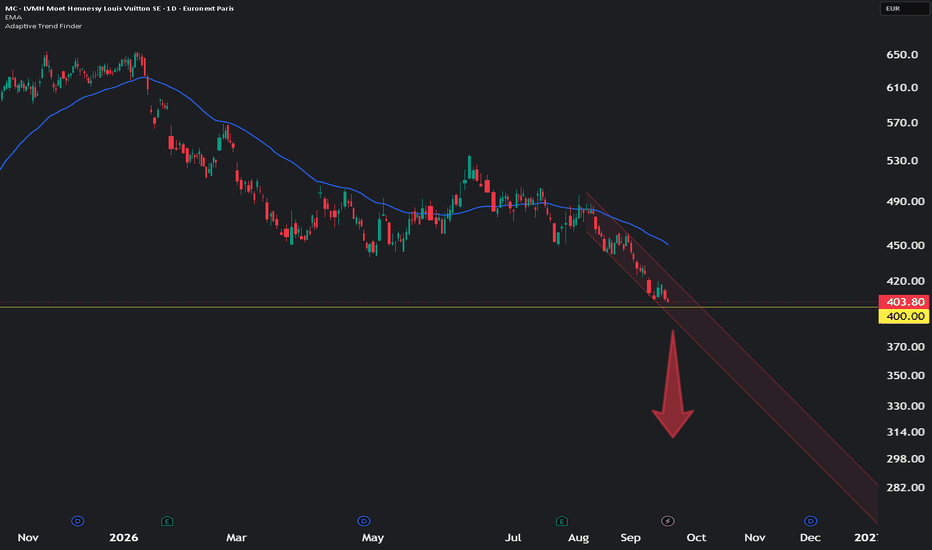
LVMH at €400: Is the Luxury Sector Entering a Crisis?LVMH remains under clear bearish pressure on the daily chart. Price is moving within a descending structure, with lower highs and lower lows, while the declining moving average continues to act as dynamic resistance.
The key level to watch is €400. This is both a major psychological threshold and the immediate support holding the current structure together. A decisive daily close below €400 would confirm renewed weakness and increase the risk of a deeper correction.
For the bearish scenario to lose momentum, LVMH would need to reclaim the descending channel and move back above its falling moving average, followed by a higher high. Until then, rallies remain vulnerable to selling pressure.
Beyond the chart, LVMH is a bellwether for the luxury sector. Persistent weakness around such a major level raises a broader question: is this simply a valuation reset, or is the luxury industry entering a more lasting slowdown?
Key level: €400
Bias: Bearish below the descending trend structure
Invalidation: Sustained breakout above the channel and the declining moving average
This analysis is for informational purposes only and is not financial advice.
Laurent - Private Investor
✅ DL INVEST | Community Leader
EUR/AUD BEARISH BIAS RIGHT NOW| SHORT
EUR/AUD SIGNAL
Trade Direction: short
Entry Level: 1.619
Target Level: 1.618
Stop Loss: 1.620
RISK PROFILE
Risk level: medium
Suggested risk: 1%
Timeframe: 1h
Disclosure: I am part of Trade Nation's Influencer program and receive a monthly fee for using their TradingView charts in my analysis.
✅LIKE AND COMMENT MY IDEAS✅
USD/CHF BEST PLACE TO SELL FROM|SHORT
Hello, Friends!
The BB upper band is nearby so USD-CHF is in the overbought territory. Thus, despite the uptrend on the 1W timeframe I think that we will see a bearish reaction from the resistance line above and a move down towards the target at around 0.813.
Disclosure: I am part of Trade Nation's Influencer program and receive a monthly fee for using their TradingView charts in my analysis.
✅LIKE AND COMMENT MY IDEAS✅
EUR/USD BEARS WILL DOMINATE THE MARKET|SHORT
Hello, Friends!
We are targeting the 1.158 level area with our short trade on EUR/USD which is based on the fact that the pair is overbought on the BB band scale and is also approaching a resistance line above thus going us a good entry option.
Disclosure: I am part of Trade Nation's Influencer program and receive a monthly fee for using their TradingView charts in my analysis.
✅LIKE AND COMMENT MY IDEAS✅
AUD/CHF SENDS CLEAR BEARISH SIGNALS|SHORT
Hello, Friends!
We are now examining the AUD/CHF pair and we can see that the pair is going up locally while also being in a uptrend on the 1W TF. But there is also a powerful signal from the BB upper band being nearby, indicating that the pair is overbought so we can go short from the resistance line above and a target at 0.583 level.
Disclosure: I am part of Trade Nation's Influencer program and receive a monthly fee for using their TradingView charts in my analysis.
✅LIKE AND COMMENT MY IDEAS✅
AUD/USD BEARS ARE STRONG HERE|SHORT
Hello, Friends!
AUD/USD pair is trading in a local downtrend which know by looking at the previous 1W candle which is red. On the 1H timeframe the pair is going up. The pair is overbought because the price is close to the upper band of the BB indicator. So we are looking to sell the pair with the upper BB line acting as resistance. The next target is 0.714 area.
Disclosure: I am part of Trade Nation's Influencer program and receive a monthly fee for using their TradingView charts in my analysis.
✅LIKE AND COMMENT MY IDEAS✅
USD/CHF BEARISH BIAS RIGHT NOW| SHORT
USD/CHF SIGNAL
Trade Direction: short
Entry Level: 0.818
Target Level: 0.815
Stop Loss: 0.820
RISK PROFILE
Risk level: medium
Suggested risk: 1%
Timeframe: 1h
Disclosure: I am part of Trade Nation's Influencer program and receive a monthly fee for using their TradingView charts in my analysis.
✅LIKE AND COMMENT MY IDEAS✅