XAUUSD Algo Map: Bearish Expansion & Decision Core Breakdown💎 XAUUSD Algo Map: Bearish Expansion & Decision Core Breakdown
📋 Report ID: XAUUSD-DAILY-2026-07-24
Asset: Gold Spot (XAU/USD)
Timeframe: Daily (Macro) / 15m (Intraday)
📊 Data Anchor: July 24, 2026 (Daily Close: July 23, 2026)
🔭 Market Context & Price Action
The daily structure for Gold (XAUUSD) has shifted into a dominant bearish expansion phase (Bearish Engulfing Body). Following a brief opening push to a high of 4141.275, institutional supply aggressively flooded the market, driving a massive drop of over $100. The asset sliced through central equilibrium metrics and closed near its low at 4049.780. Closing deeply beneath the primary decision core decisively confirms the loss of buyer control and establishes a strong bearish bias heading into the weekly close.
🎯 Key Structural Price Zones
The following zones map the absolute structural boundaries and immediate battlegrounds:
🔴 Absolute Structural Ceiling: 4215.065
This mathematically derived boundary represents the absolute maximum upward ceiling (Final Ceiling) for the macro cycle. Intermediate upper extensions reside at 4178.170 and 4171.345.
🔴 Primary Resistance & Flip Zone (Decision Core): 4077.080 - 4090.730
The critical structural fault line. This dense band combines the central computational core (4077.080), the primary algorithmic layer (4087.720), and the 50% equilibrium threshold (4090.730). Having collapsed below this zone, this former support block has transitioned into a major overhead supply barrier (Flip Zone). Higher intermediate resistance extensions sit at 4095.528 and 4105.380.
🔵 Immediate Support Base: 4031.247 - 4040.513
The primary physical floor. This zone, anchored by the session low of 4040.185 and supported by lower algorithmic boundaries at 4031.247, temporarily halted the selling cascade late in the session.
🔵 Deep Strategic Demand Zone (Discount Target): 3994.180 - 4014.606
The primary target cluster for sellers. This dense demand block incorporates lower computational boundaries spanning from 4014.606 down through 4012.885, 3999.235, and the extreme floor boundary of 3994.180.
⚫ Absolute Structural Floor: 3911.795
The ultimate underlying macro safety net (Final Floor). Extended downward targets ahead of this floor lie at 3975.990 and 3969.165.
⚖️ Order Flow & Trade Scenarios
Bearish order flow is currently dictating price action, favoring "Sell on Rally" setups:
🔴 Bearish Scenario (Primary - Sell on Rally): As long as the price remains capped beneath the 4077.080 - 4090.730 decision core, the dominant strategy is selling into corrective rallies. Any pullback into the 4067.856 - 4077.080 pivot region offers a high-probability entry for a retest of the 4040.185 physical low. A confirmed breakdown beneath 4031.247 will accelerate the expansion toward the 4014.606 and 3994.180 deep demand block.
🟢 Bullish Scenario (Structural Invalidation): To neutralize the current bearish momentum, buyers must drive price action back above the decision core, securing a confirmed daily close above 4090.730. This would invalidate the bearish setup and reopen the path toward upper supply at 4113.975 and 4139.554.
──────────────
Trade Safe and follow the structure.
◈ Quantix Labs
Bearish Engulfing
NZD/USD Falls as RBNZ Hike Path Gets MessyNZD/USD fell as much as half of one percent to start the week as the U.S. Dollar regained ground coming out of the holiday weekend. U.S. yields were mixed, but the broader dollar tone improved as markets wait for Wednesday’s Federal Reserve minutes and reassessed how much room the Fed really can ease – or worse yet, have to tighten – while inflation remains sticky. That left the New Zealand Dollar exposed, especially after a rough stretch where global growth concerns, softer commodity sentiment, and fading risk appetite have weighed on higher-beta currencies.
In New Zealand, the focus is squarely on the RBNZ’s July 8 policy decision. The Official Cash Rate (OCR) sits at 2.25%, but the debate has shifted from easing risk to whether the central bank needs to gradually remove accommodation as inflation stays above target. The limiting factor for delivering a rate hike is growth. The IMF recently warned that New Zealand’s recovery has been delayed by the oil shock and global uncertainty, with inflation expected to stay above the RBNZ’s target band through year-end. That leaves the RBNZ with an ugly, almost stagflation-like mix: inflation too high to turn dovish, growth too soft to sound aggressive.
In the above chart, NZD/USD is struggling to establish a bottom after hitting fresh yearly lows within the past two weeks. The rebound has seen a bearish evening star candlestick pattern emerge against the 1-month moving average, suggesting that recent gains haven’t been significant enough to confidently call a durable low. Similarly, a close below 0.5681 would mean failure to retake the April swing low and would offer greater confidence that a return to the yearly low at .5627 could be revisited soon.
Will US Reversals Hold?As of last week's close, all major US indices completed their weekly movements, and all of them indicated a reversal pattern.
S&P 500, Nasdaq, and Russell 2000 all formed a bearish engulfing pattern, while the Dow Jones formed an inverted hammer.
So, is a correction coming?
Based on these technical studies, a correction appears to be developing.
We will discuss how to manage these risks and whether this correction will be shallow or deep.
Micro E-mini S&P 500 Index Futures & Options
Code: MES
Minimum fluctuation
0.25 index points = $1.25
Disclaimer:
• What presented here is not a recommendation, please consult your licensed broker.
• Our mission is to create lateral thinking skills for every investor and trader, knowing when to take a calculated risk with market uncertainty and a bolder risk when opportunity arises.
CME Real-time Market Data help identify trading set-ups in real-time and express my market views. If you have futures in your trading portfolio, you can check out on CME Group data plans available that suit your trading needs www.tradingview.com
Upcoming Correction: Shallow or Deep?Friday’s closing completed the weekly chart, with all indices indicating a reversal pattern. A correction is imminent. The question is whether this correction will be shallow or much deeper. How can we tell? Stay tuned for my upcoming video in the coming days.
Disclaimer This analysis is based on technical studies and does not constitute financial advice. Please consult your licensed broker before investing.
Micro E-mini S&P 500 Index Futures & Options
Code: MES
Minimum fluctuation
0.25 index points = $1.25
Disclaimer:
• What presented here is not a recommendation, please consult your licensed broker.
• Our mission is to create lateral thinking skills for every investor and trader, knowing when to take a calculated risk with market uncertainty and a bolder risk when opportunity arises.
CME Real-time Market Data help identify trading set-ups in real-time and express my market views. If you have futures in your trading portfolio, you can check out on CME Group data plans available that suit your trading needs www.tradingview.com
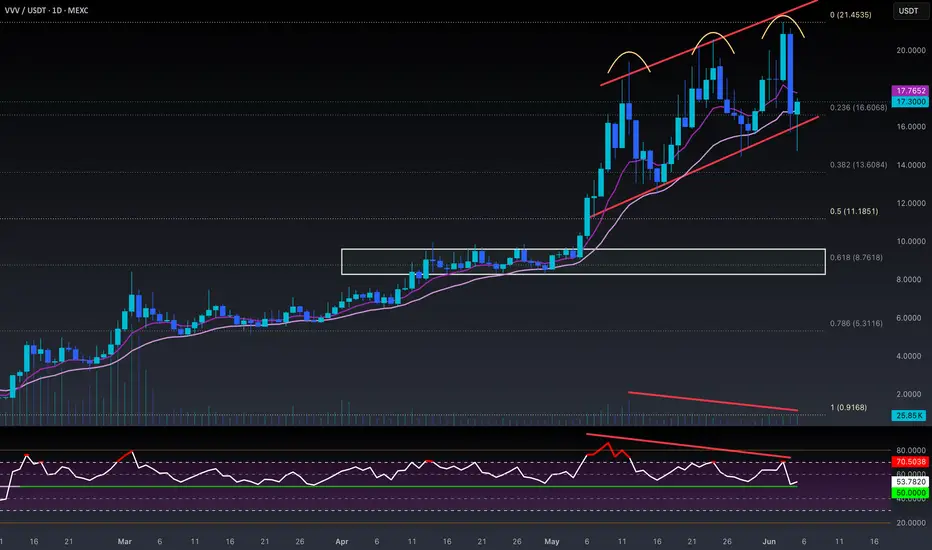
$VVV Top Confirmed with Bearish Engulfing + H&SNYSE:VVV TOP IS IN 💯
NASTY BEARISH ENGULFING Daily Close confirms Head & Shoulders reversal pattern (w/ a fake-out from upthrust).
PA responds with a dead-cat bounce into the bull flag (one last trap).
This will take a lot of time for the market to digest.
Should see a proper retest of the 50% gann level to decide next move.
Doubt that will hold with current macro market conditions coming online.
Would steer clear til ~$8-9 which is around the .618 Fib.
Better value buy sits ~$5 at the .786 fib
LOWER 📉
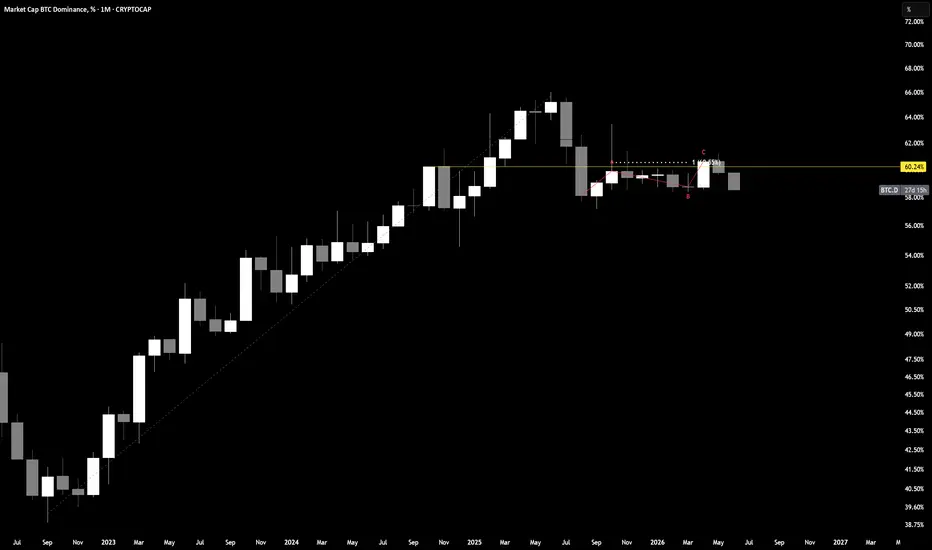
₿ Dominance Swing Failure Pattern - (CAP)Continuation Acceleration Protocol (CAP) status: one of the cleanest macro rotation signals in crypto just printed on the weekly.
BTC dominance posted a Swing Failure Pattern at the cycle high. Price swept above the prior structural high, failed to hold, and is now rolling over with the weekly close sitting at 58.18%. The Consequent Encroachment level at 60.24% acted as the exact rejection zone.
This pattern has a perfect historical record. Every prior SFP at a dominance cycle high has preceded a sustained altcoin rotation. Not a bounce. Not a few days of green. A structural shift in where liquidity flows across the entire market.
The mechanism is not complicated. Dominance sweeps the high to collect the stops and trigger the breakout chasers. When it fails to close above, every participant who bought the breakout is now offside. That unwind is the fuel. The rotation that follows is not sentiment-driven. It is structural.
Current price is at 58.18% and declining. The weekly candles show compression giving way to distribution. Volume on the rejection is the confirmation the pattern needed.
Invalidation is a weekly close back above 60.24%. Until that prints, the SFP is active and the historical precedent is undefeated.
The altcoin rotation does not announce itself. It just starts. And by the time the crowd notices dominance has already moved.
USOIL: Bearish Engulfing with Bearish Divergence Targeting $66As stated in the descriptions previous ideas I have included in the related publications oil was likely to significantly spike up but then pull back significantly below $100 for at least a week or so as the indexes staged a recovery. So far we have seen a spike up reaching as high as $119 per barrel or $2.84 per gallon and we have seen a decline and stagnation around the $100 per barrel or $2.40 per gallon mark all the way down to as low as $77BLL or $1.84GLL, but we have since rallied back to the $100 zone. However, at this level we have seen Oil Bearishly Engulf on the Daily Timeframe and have seen Bearish Divergence in the RSI. I think it is likely that oil will have to see an even greater pullback towards the 200-day EMA in white currently at around $66 per barrel and $1.56 per gallon and fill the unfilled gap. After coming down to test the 200 EMA and filling the gap at $66 I think oil could very well continue higher reaching as high as $178 per barrel but that's a long time from now.
Previous Bullish Oil trade listed in the description of this idea .
Most recent call for Index recovery and for Oil to come back down well below $100 listed here.
Havells Trendline BreakHavells has given a breakdown of a trendline on the daily timeframe with a bearish engulfing candle. After a good upside this breakdown can be seen as a reversal trade. One can look for an short entry at-
Entry- 1416-1420
SL- 1450
Target 1380, 1360 and swing traders can even look for targets of the gap which is seen on the chart.
Follow for more such learnings and analysis.
Disclaimer- This is just for educational purpose.
JAI SHREE RAM.
Critical Macro Signs Seen on SPOT, warrant attentionSpotify has been a fan favorite for the last few years. I mean who wouldn't fall in love with it. It has had roughly 850% gains since Feb 2023.
And so its recent downtrend requires attention. Traders and investors alike are wondering if this is buy the Dip situation with many probably been doing so. But you have to take the time and ask yourself am i acting on emotion such as Fear of Missing Out or am i acting on evidence, actual signs that indicate it really is Buy the Dip situ.
Many people from hedge fund guys to influencers will say things, signals will be called. But the attention should be put on the facts in the charts. We should consider what price action is telling us and if there are clues in certain indicators or not.
Since we have been in a Uptrend for roughly 2 - 3 years, we have to consider SPOT to have experienced a Bull run. With recent downtrend, we have to then consider whether or not the Bull trend is INTACT or if its being invalidated or in other words if the current downtrend shows signs that Trend is reversing. If signs of reversal are present it may not be a Buy the dip situation.
IN trading and Investing, we must remove Emotion, Humble ourselves and consider all scenarios at all times.
Okay so we will look into the Macro picture of price action. Ill start with the 1 Month timeframe. Note that each candle is 1 Months average of opening/closing price. Macro analysis is a powerful tool especially to determine large picture, long duration trends like Bull runs or bear markets.
June 2025 we reached a high of roughly $770. But the Month after (July) We experienced extreme sell off indicated by the Engulfing Bearish candle. Which on the 1 Month is an alarming sign. (This could be the top)
Followed by 3 Months of attempts to get back on track of the trend. Which met with continued SELL pressure indicated by the Large Upper wicks in August & Sept.
Then from October we continued to sell off. Fast forward to this current month of January. We are on the verge of printing another Large Body Bearish Candle. Which warrant caution.
Candle bodies and its size indicate the strength of that candles move and may even help determine price moves in the future. Incase of Monthly candles, a large candle print can make impacting future moves more probable. Something to consider.
We are also in the process of breaking down below a Horizontal Support line where Jan to March 2025 we maintained Support or showed Buy pressure on.
This may be a low that could invalidate our Bull run.
Our current Monthly candle is also in a crucial Support zone depicted by yellow zone.
There are 2 Bull Support Trend lines depicted by green lines. Where we can attempt to test Support. We are currently doing so on the first line.
If we fail to hold here, we would test Support at the lower order of the Yellow zone.
If we fail to hold here, we'd test Support at the Lower green line.
And if this fails we would attempt Support at the Resistance Turned Support line at around $300.00.
We have 2 days in the Month. If we can have Buy pressure come in and have this months candle wick back above the Support line we are breaking. That would be a solid sign for bullish case. But dont think its a probable case.
We would need to see signs of confirming Support if we are too continue the Bull run.
Till then SPOT warrants caution and in my opinion definitely not a Buy the Dip situation at this moment.
We need to show patience in the markets if we want to be successful and not be on the end of a losing position.
Follow me and continue to observe SPOT. Look to more updates to the analysis.
EURJPY bearish expectations from here
OANDA:EURJPY we can see BEARISH ENGULFING candle, after bearish engulfing looks like coming descending triangle. We are have constant bullish trend here long period and here after todays events expecting to see point of revers.
SUP zone: 182.500
RES zone: 180.300, 178.900
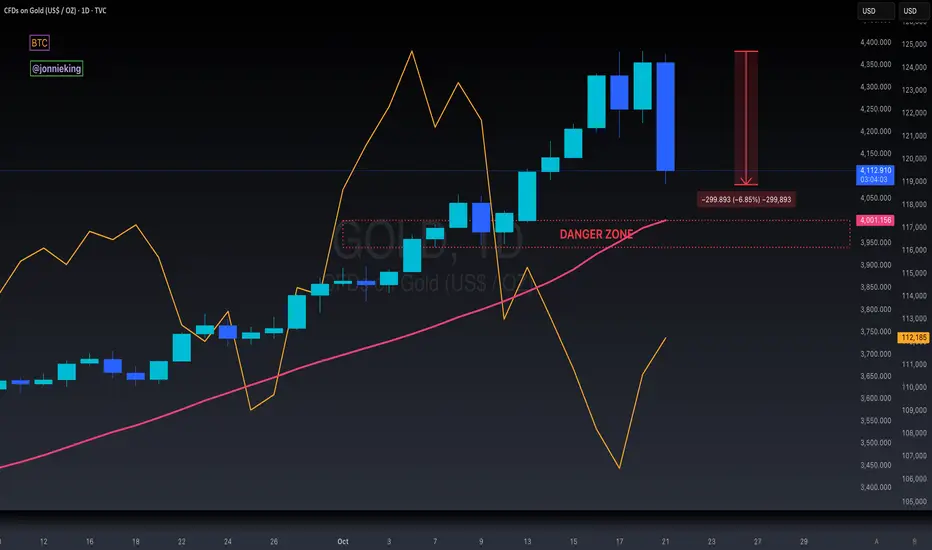
$GOLD Bearish Engulfing on Daily - Rotation to $BTC Incoming!MASSIVE BEARISH ENGULFING FORMING ON THE TVC:GOLD DAILY CHART.
Down ~7% just on the day alone.
~$2 TRILLION has been wiped out on its market cap,
the equivalent of Bitcoin’s entire MC.
We can see the rotation into CRYPTOCAP:BTC in real-time here.
If GOLD Closes below the DANGER ZONE,
it’s game-over for everyone’s favorite pet rock 🪙
$BTC Has Entered the DANGER ZONEI warned ya’ll about this ₿itcoin correction on the 15th when that big bearish engulfing candle printed.
CRYPTOCAP:BTC has now officially entered the DANGER ZONE with a break below the 100DMA, 0.236 Fib and previous local high territory.
If PA breaks even further, next stop is the 0.382 Fib ~$105k and possibly the 200DMA ~$101k
$BTC Bearish Engulfing Candle AlertGOOD NEWS:
-CME Gap was completely filled.
-PA is still above the 20DMA.
BAD NEWS:
-Very concerning Bearish Engulfing candle on the Daily Close.
-Volume confirms the change in trend.
MY TAKE: I wouldn't be surprised to see the market rally into a low liquidity weekend and dump hard on Monday.
EURJPY Tapped 4H Supply – Massive Drop Loading?EURJPY | 30-Min View with 4H CRT Zones
🔥 This is where Smart Money sharpens their blades…
🧊 New Confluence Just Dropped:
🔴 CRT 4H High Zone: 165.108–165.475
Price wicked right into the 4H Compression Reversal Top (CRT) — ideal Smart Money trap zone
This area aligns perfectly with the bearish OB/supply from previous screenshot
🔵 CRT 4H Low Zone: Around 164.630
Strong structure level where liquidity is sitting
Price respected it as temporary support before likely break-and-retest continuation
🔍 Price Action Logic:
✅ Price faked out above CRT 4H High, grabbing liquidity
✅ Immediate rejection candle with wick rejection signals institutional selling
🔁 Now price is retesting the mid-OB / lower CRT, likely forming a breaker pattern
🟥 Huge clean imbalance to the downside — marked by that juicy green TP box
🔽 Expectation: price fills inefficiency and heads to 163.378 minimum
🎯 Trade Parameters:
🔻 Entry Zone 165.100 – 165.397 (Red Supply / CRT High)
🛡 SL Above 165.475 (CRT 4H High)
🎯 TP Target 163.378 (bottom imbalance fill)
⚖️ RRR Over 1:4 potential — high precision entry zone
🧠 Chart Ninja Analysis:
“When CRT zones align with OBs and liquidity sweeps,
that’s a Smart Money feast waiting to happen.” – 🥷
This chart is a classic reversal blueprint. If you missed the first tap — wait for the retest. If this holds below CRT Low (164.630), expect full bearish momentum into midweek.
📊 Confirmation Tactics:
🔄 M15 bearish engulfing / shift in structure after tap into CRT
🔻 Break of 164.630 = confirmation of bearish intent
⏳ Optional: use FVG + volume spike as further entry triggers
🚨 Save this chart — it's one of those sniper moments where everything aligns!
CADCHF - Sell Short - Trendline and Candle stick confluences. Market is making a series of LH and LLs- Market has rejected from trend line resistance. Bearish Engulfing candle formation is a strong confluence of market bearish trend.
we can instant enter in the market, SL would be slightly above Last confirmed LH and TPs would be with R:R of 1:1 and 1:2 respectively.
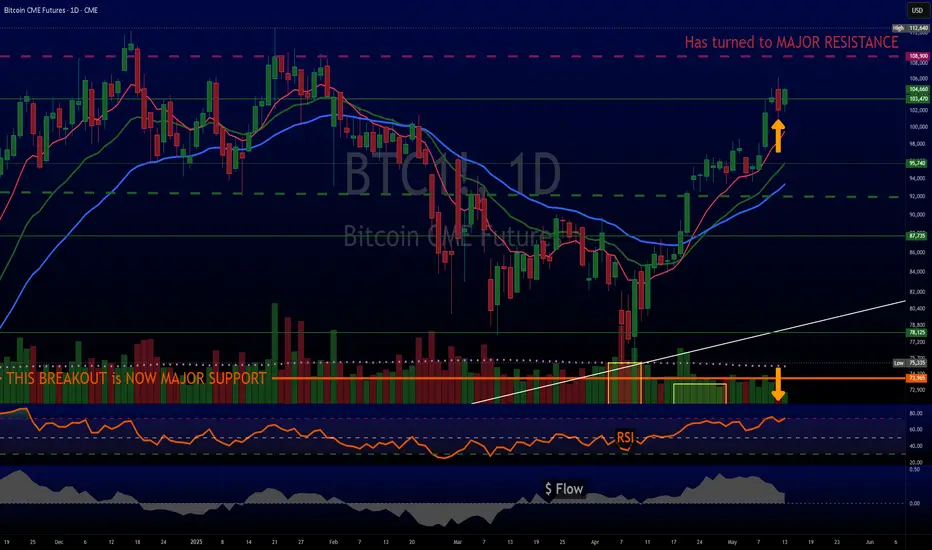
Bearish sign but we think it pushes to MAJOR RESISTANCEYesterday CRYPTOCAP:BTC formed a BEARISH ENGULFING. We've spoken on this pattern countless times.
However, we didn't bring it up because we didn't/don't think it's relevant.
WHY? Look at the paltry volume. Bitcoin volume is SUPER LOW.
BTC is still in Bullish mode from Late 2022.
---
We turned Bullish again on CRYPTOCAP:BTC around early April:
A) We saw that huge Bitcoin selloff 4/7
2) Which reversed that same day
3) Followed by some buying a couple days later
4) More BTC accumulation 4/21 when it was under 88k
Major resistance coming up soon.
Pause HIGHLY LIKELY.
Mastering the Bullish Engulfing PatternHello, Traders! 👋
Finding powerful reversal signals in a downtrend can be challenging, but what if a pattern was so visually striking that it's almost impossible to miss? Enter the bullish engulfing pattern – one of technical analysis's most reliable reversal signals. Today, we'll explore everything you need to know about the bullish, engulfing candlestick pattern and how to trade it effectively.
What Is a Bullish Engulfing Candle? 🔍
The bullish, engulfing candlestick tells a compelling story of market psychology. After a downtrend, a small bearish candle appears, suggesting continued selling pressure. But then something dramatic happens—a powerful bullish candle completely “engulfs” the previous day's trading range, signaling a dramatic shift in market control.
When asking, “what is a bullish engulfing candle?” think of it as a visual representation of bulls overwhelming bears in a single, decisive battle. The engulfing bullish pattern is particularly powerful because it shows not just buyer interest but complete buyer dominance.
Identifying the Perfect Bullish Engulfing Pattern 🎯
On the left side of the chart, we can see the formation of the Bullish Engulfing pattern. This consists of a smaller red candle completely engulfed by a larger green candle that follows it. To spot a valid bullish engulfing candle pattern, look for these essential elements:
A Clear Downtrend: Like any great comeback story, the engulfing bullish formation needs context.
First Candle Characteristics: A relatively small bearish candle, showing the last gasp of selling pressure.
The Engulfing Candle: The second day's bullish candle must completely engulf the previous day's real body, which puts the “engulfing” in bullish engulfing.
Opening and Closing Prices: The engulfing bullish pattern requires the second candle to open below the previous close and close above the last open.
On the right side of the chart, we can observe the Bearish Engulfing pattern. This formation shows the opposite scenario, where a larger red candle completely engulfs the body of the previous green candle. This pattern forms after several bullish candles, suggesting a potential reversal of the upward movement.
Why Does the Bullish Engulfing Pattern Work? 📊
The power of the bullish, engulfing candlestick pattern lies in its psychology. When a downtrend is in place, sellers feel confident, but the appearance of an engulfing bullish candle represents a dramatic shift in market sentiment. This sudden change often triggers a chain reaction:
Stop Losses Trigger (short sellers rush to cover their positions)
New Buyers Enter (fresh capital flows in as traders recognize the reversal signal)
Momentum Builds (the combination creates a self-reinforcing upward cycle)
Trading the Bullish Engulfing Pattern: A Strategic Approach 💡
Successfully trading the bullish engulfing pattern requires more than just pattern recognition.
Volume Confirmation: Look for higher-than-average volume on the engulfing day, confirming strong buyer participation.
Support Levels: The pattern becomes more powerful when it forms near key support areas.
Size Matters: The larger the engulfing bullish candle, the more significant the potential reversal signal.
Overall Market Trend: The pattern carries more weight in line with larger timeframe trends.
Market Conditions: Consider volatility and trading volume when assessing pattern strength.
Bringing It All Together 🎓
The bullish engulfing pattern is one of technical analysis's most powerful reversal signals. By understanding its formation, psychology, and proper trading approach, you can add a valuable tool to your trading arsenal.
Remember: successful trading isn't about finding a perfect pattern—it's about finding and managing high-probability setups. When adequately identified and traded, the bullish, engulfing candlestick pattern offers precisely that kind of opportunity.
BITCOIN → False Breakout & Bearish Engulfment ↓ BINANCE:BTCUSD entered a strong buying zone (68900) within the rally. BUT, the expected growth did not happen, the bulls could not realize the potential. A bearish engulfment of the last three bars is formed and actually - a false breakdown of the descending resistance...
The growth formed from 59K is partly connected with the election race in the USA, economic revival in China, as well as economic news. But apparently, this energy is not yet enough for the price to easily overcome 68-69K with a target of retesting 71-73. The resistance zone of 68.4-69.4 is putting pressure. Buyers are taking profits, while bears, seeing the strong resistance zone, are trying to resist.
The structure will break down if the price breaks 69400
At the moment, we see a bearish engulfment forming relative to the previous three bars, and this is a strong enough signal. Consolidation below resistance is forming, a small correction may be formed, the first target of which may be 65K, then 61-58-57.
Resistance levels: 68400, 69400, 71500
Support levels: 66500, 65000
After the false breakdown, the price consolidation is formed below the resistance, which indicates the pressure from the sellers. This may provoke further downward correction.
Rate, share your opinion and questions, let's discuss what's going on with ★ BINANCE:BTCUSDT ;)
Regards R. Linda!