PATH - Price Reclaims 50-EMA and 200-EMAPATH - CURRENT PRICE : 14.50 - 14.70
PATH is gaining traction after reclaiming both the 50-EMA and 200-EMA, signalling a shift back into short-term bullish momentum 📈. Price strength is supported by rising RSI and an improving MACD cross, suggesting buyers are regaining control.
🔥 Bullish Points
Price reclaimed 50-EMA and 200-EMA
RSI trending above 50 → bullish momentum returning
MACD turning positive with increasing histogram
Volume uptick on recent green candles = buyers active
ENTRY
Bullish Divergence
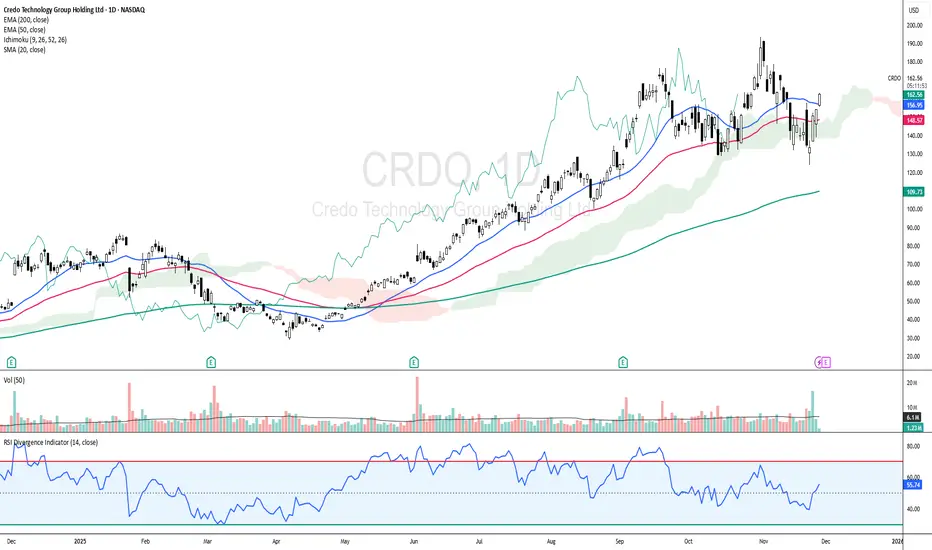
CRDO: Cloud + EMAs Aligning for Upside ContinuationCRDO - CURRENT PRICE : 162.95
CRDO is showing a bullish reversal setup as price rebounds and closes back above the EMA50 while holding firmly above the Ichimoku Cloud , signaling the major trend remains intact. Momentum is improving with RSI rising above 50 and not yet overbought, supported by increasing volume on the recent bullish white candlestick.
Today’s move above the 20-day SMA adds a positive layer to the short-term trend structure. Short term targets are 175.00 and 185.00 while s
$BTC 4H Analysis – Clear Bullish Structure FormingRight now on the 4-hour chart, BTC is clearly building a strong bullish pattern.
🔹 Price action is forming a clean Inverse Head & Shoulders structure.
🔹 RSI is showing a bullish divergence, meaning momentum is strengthening while price is stabilising.
🔹 This setup usually indicates a breakout move once the neckline is breached.
If BTC starts rising from the current zone, the market is likely to grab liquidity near the $97,000 level, which is the next major area where stop-loss clusters and p
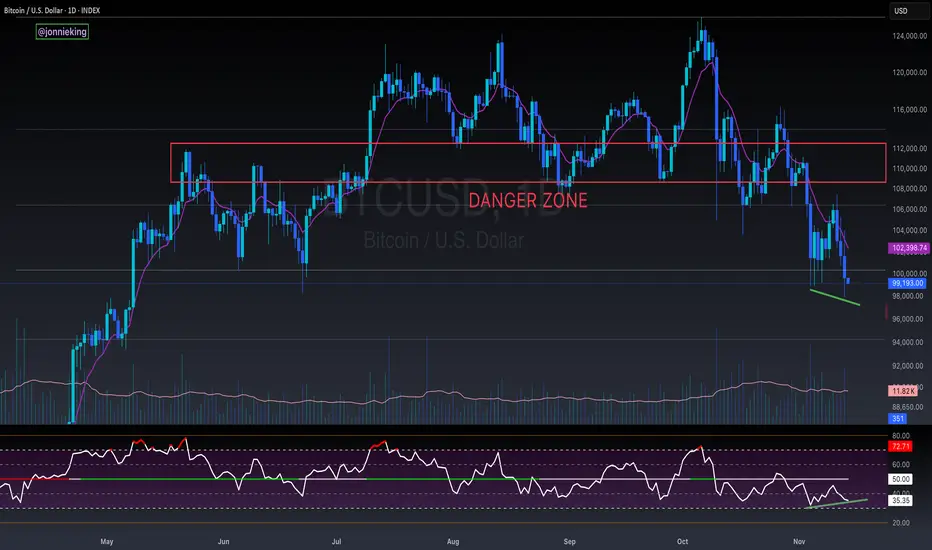
btc finds 200 ema support, whats next?As I have been posting in these "Ideas" for the past few weeks about market direction and where the price for BTC will go. It now has come to pass where the 200 EMA has been tested and support has been found, It however has not generated any relief among buyer sentiment unable to push price above the previous days close leaving the digital asset to continue to bleed out and cause positions from all the 93k Bulls to liquidate.
Its a shame people cannot make the connection that the only way
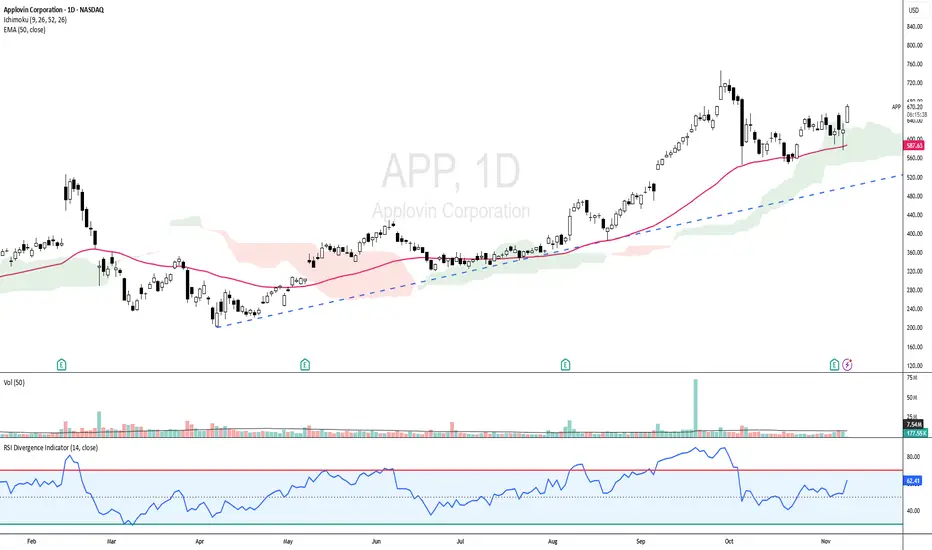
APP - UPTREND STILL INTACT!APP - CURRENT PRICE : 670.00 - 674.00
APP is showing strong bullish momentum as the price trades above the 50-day EMA and ICHIMOKU CLOUD , indicating a sustained uptrend. The RSI is in bullish territory but not yet overbought, indicating room for further upside. With the current setup, the stock has potential to retest its all-time high area if momentum continues.
ENTRY PRICE : 670.00 - 674.00
FIRST TARGET : 727.00
SECOND TARGET : 770.00
SUPPORT : 50-day EMA
ANET - Rebounds from EMA 50ANET - CURRENT PRICE : 148.00 - 149.00
Technical Rationale:
1. Rebound from Key Moving Average Support
The stock price has rebounded strongly from the 50-day EMA, which has acted as a dynamic support level throughout the uptrend. This rebound indicates renewed buying interest at a technically significant area.
2. Bullish Momentum Confirmation
ANET has crossed above the 20-day SMA, suggesting a short-term shift back to bullish momentum after a healthy pullback. This crossover reflects improvi
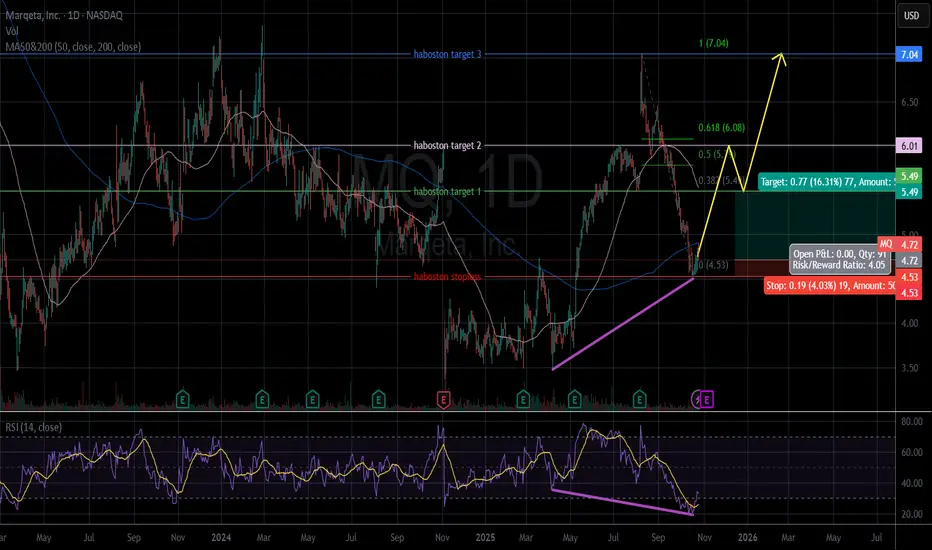
MQ - Bullish divergenceAfter MQ oversold, its price is recovering with very clear Bullish divergence sign.
The price closed 10.24.2025: $4.72.
Price target: $5.49/ $6.01/ $7.04
Stop loss: $4.53.
IMO, amateur trader.
Good luck!
MLong
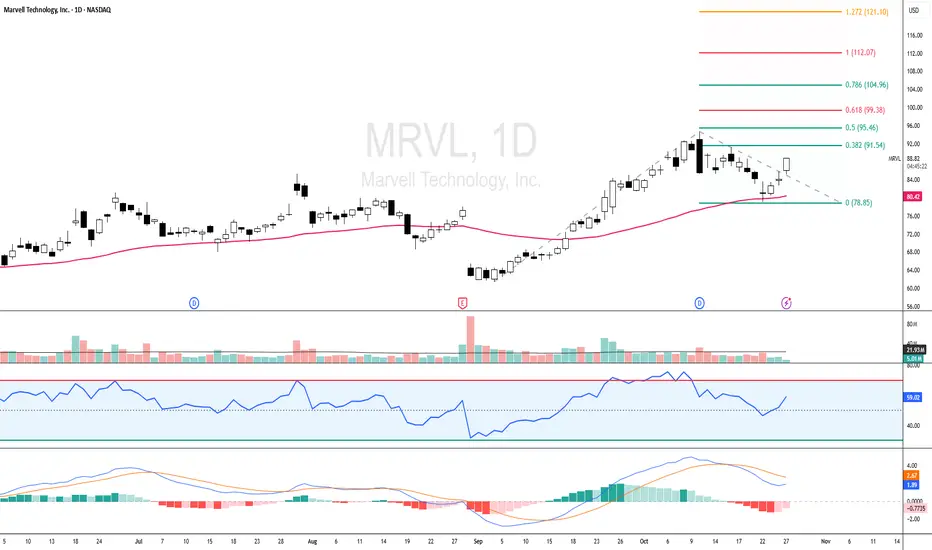
MRVL - RSI Back Above 50, Eyes Fibonacci Targets at 99 and 112MRVL - CURRENT PRICE : 86.00 - 88.00
MRVL is showing early signs of bullish continuation after finding support near the 50-day EMA and rebounding with positive momentum. The price structure remains healthy as it trades above the EMA 50, suggesting the medium-term trend is still intact.
Key Technical Highlights :
1) Price Above EMA 50
The stock price is holding above the EMA 50, showing that the uptrend remains valid and buyers are still in control.
2) RSI Above 50 and Not Overbought
RSI has
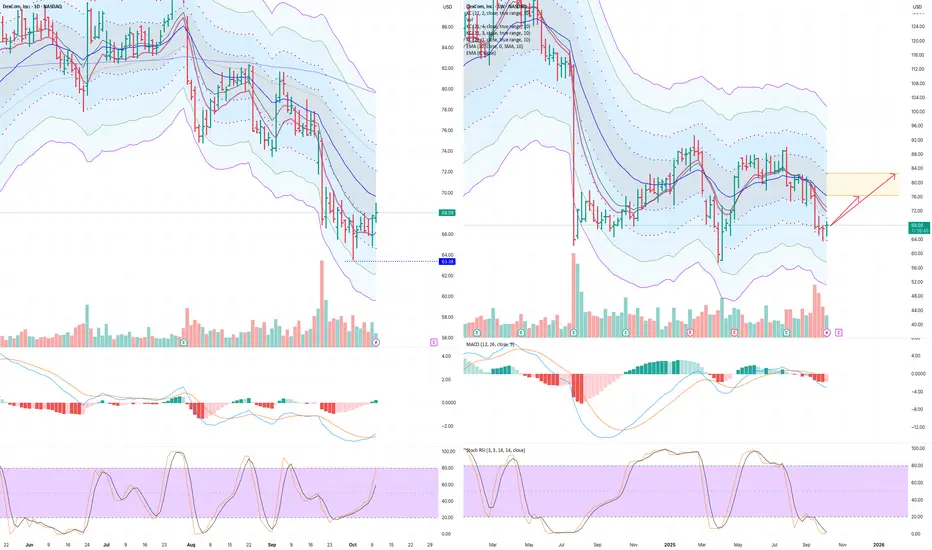
IMCD Daily Bullish Divergence + 1st Higher lowBullish div on ME and mLines, also 1st HL that ticks above -1 ATR now, but bar only 50%
low forming takes a while, bullish div on X5, price above -1 ATR now on 1D, looks good. Low vol stock tho
I scale out 2/3 at 1 ATR, at TP1, then let the 1/3 remainder run into a possible uptrend
TP1
92,42
TP2
evaluate
E
88,96
SL
87,04
Trade #00017
Bullish Divergence
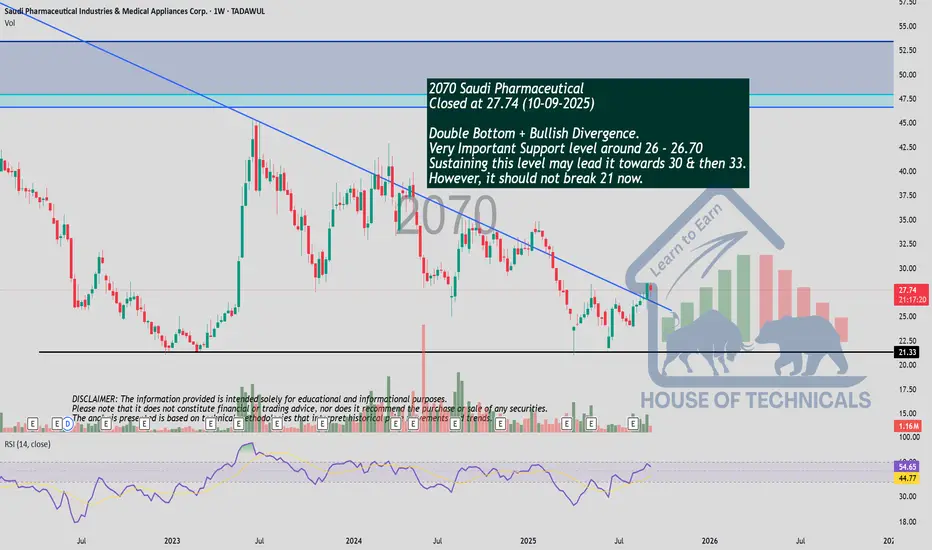
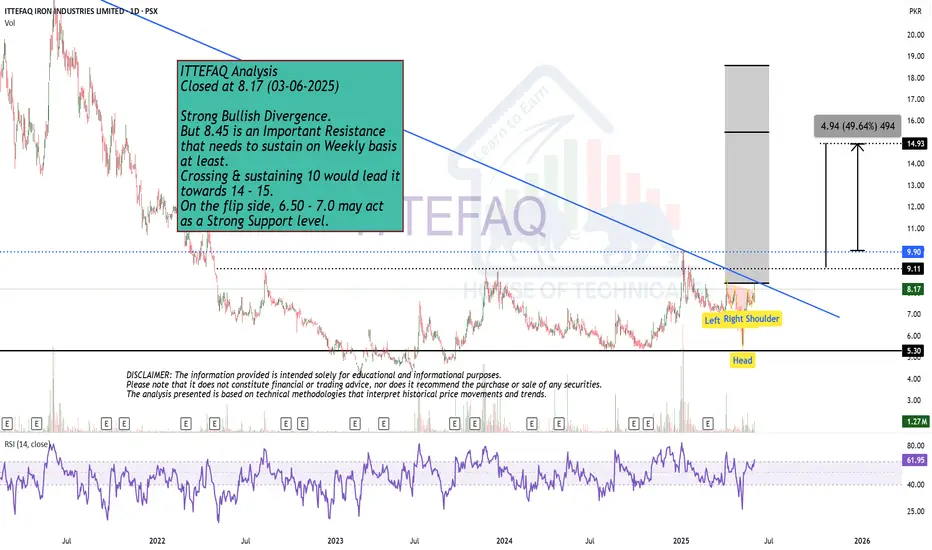
Closed at 26.89 (05-06-2025)
27.50 - 28 is an Immediate Important
Resistance that needs to cross & sustain
for further upside.
There is a Bullish Divergence which may
help this time to break the resistance.
But better approach would be to wait
for the Resistance to cross & then take entry.
If it does, 32 - 33 is easily reachable.
On the flip side, it should not break 23.50
otherwise there would be more selling pressure.
DRIFT Breakout Setup – Higher High + Retest in PlayDRIFT is showing strong bullish momentum after months of accumulation. The token has broken out, printed a higher high, and is now retesting the previous range high as support — a classic setup for continuation.
With price hovering near the 21-day EMA, this zone could act as a launchpad if sentiment holds. The structure supports a potential leg higher, making this a high-reward, low-risk opportunity for swing traders.
🔹 Trade Setup
Entry Zone: $0.68 – $0.72
Take Profit Targets:
🥇 $1.02
🥈 $1.2
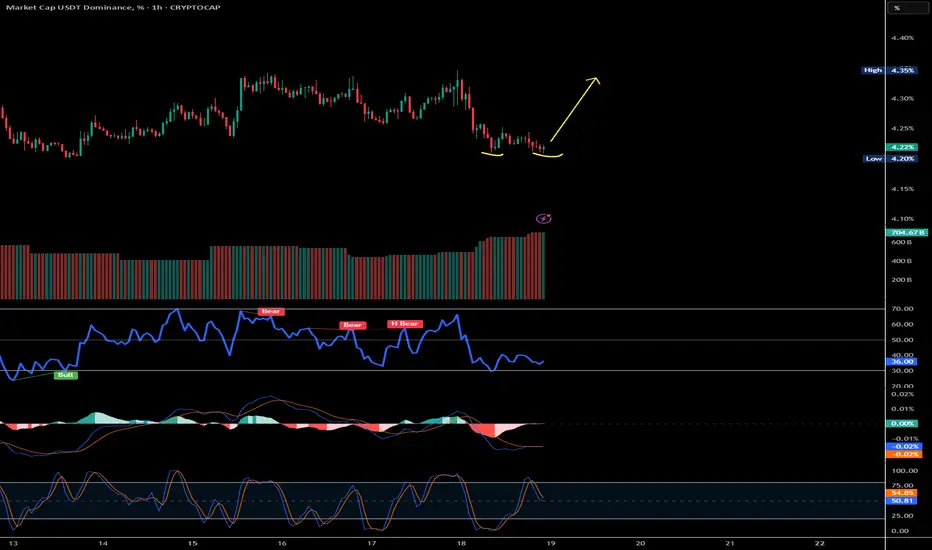
$USDT Dominance Bullish Divergence Signals RotationUSDT dominance is flashing a clean bullish divergence while MACD builds a tidy double-bottom structure. When the USDT share of the market starts climbing, it usually means traders are rotating into cash for safety. That often lines up with softer BTC momentum and underperformance across altcoins.
What I’m watching:
Momentum: bullish divergence suggests buyers are defending the recent higher low on dominance.
MACD: a double bottom with a fresh uptick strengthens the case for a push higher.
Ma
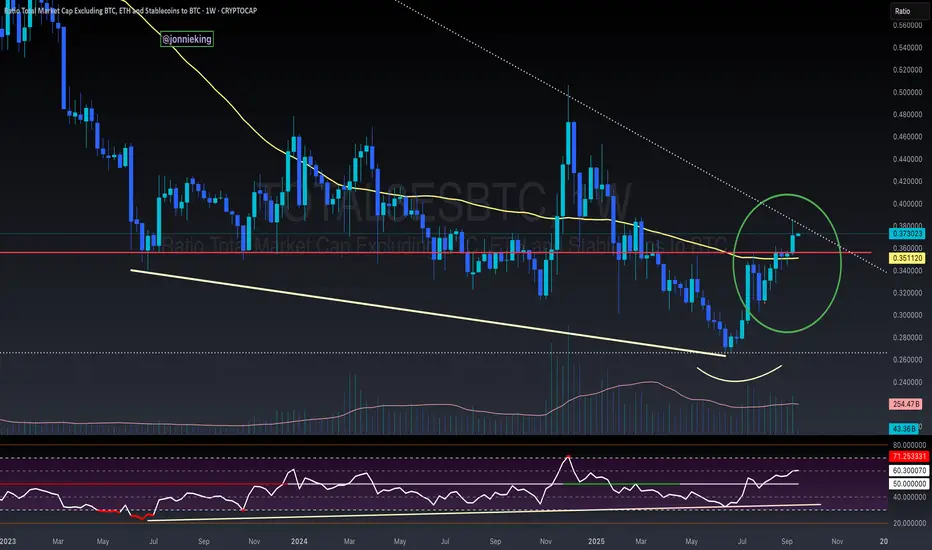
$TOTAL3 / $BTC More Confirmation for Alt Season RotationWe already saw this pattern play out with CRYPTOCAP:TOTAL2 / CRYPTOCAP:BTC and now we have it with CRYPTOCAP:TOTAL3 confirming the rotation into smaller caps.
4th consecutive Weekly close above the 50WMA.
Notice the Bullish Divergence with the RSI.
I’d like to see a few closes above this trend line for added confirmation, but I’m confident we’ve changed the trend.
Note CRYPTOCAP:OTHERS is not there yet, hence why its BTC -> ETH -> Large Caps (SOL).
BTC.D Breakout Validates Bullish DivergenceOver the past few weeks, I’ve repeatedly highlighted the bullish divergence forming on BTC dominance. Now that dominance has started moving upward, we’re witnessing the impact — heavy bleeding across altcoins.
The rising BTC.D structure signals that capital is flowing back into Bitcoin, leaving alts vulnerable to sharp corrections. This trend could extend further if dominance continues to climb, putting additional pressure on weaker altcoin setups.
📊 Key takeaway: Keep monitoring BTC.D closely —
BTC testing key liquidity zones with bullish divergence but rejeOn the 4H chart, BTC recently showed a clear bullish divergence that sparked an upward move. The current structure points toward a favorable liquidity zone between 120k and 118k, but the real test lies at the 122k level. If BTC can hold above 122k, momentum could continue, but failure to sustain will likely bring a rejection back near 119k. With the weekend approaching and typical sell pressure often kicking in around Monday or Tuesday, traders should stay cautious. Longs from lower levels are l