Bearish Divergence Playing Well!KSE100 Closed at 182338.12 (29-01-2026)
Bearish Divergence played well. Also there is Bearish Divergence in volumes.
Immediate Support seems around 179500 - 181000
Weekly Closing above blue trendline may bring some positivity in upcoming week.
Index still has the potential to touch 195,000 - 200,000 & then 210,000 but only
if it Crosses & Sustains 190000 -191500 with Good Volumes.
Bullish Flag
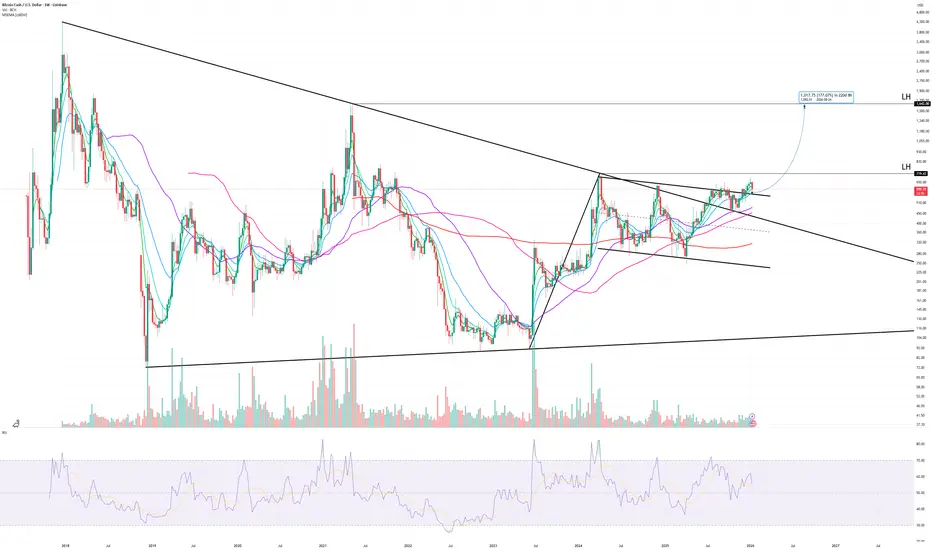
Bitcoin Cash BCH Breaking Out Of A Sym Triangle With A Bull FlagHello Traders,
Here is my chart for Bitcoin Cash BCH. As you can see it looks like the price has broken out of a symmetrical triangle and has bounced on top of the top trendline of the symmetrical triangle which is a bullish sign.
Also the price looks to have formed a bull flag as the price has broken the top trendline of the symmetrical triangle and the price looks to be pushing up from the bull flag. Momentum looks good on the RSI as well with the monthly reading 61.5 (middle ground) , week
Tron continuing to climb the measured move lineUsually when you see a measured move line treated like a staircase by price action and by this many consecutive daily candles probability is good that the breakout will be validated. If so, the target for this one is around 43-44 cents. *not financial advice*
AMAZON - EMA 200: Where Institutions Step InAMZN - CURRENT PRICE : 237.70
📈 AMZN — Institutional Support Holds, Momentum Breakout
AMZN continues to trade in a primary uptrend, with EMA 200 acting as a strong institutional accumulation zone. Multiple pullbacks toward the EMA 200 (highlighted in green) were met with immediate buying interest, confirming long-term demand.
Momentum is now turning bullish:
🔥Price has broken back above the Ichimoku Cloud, signaling trend resumption.
🔥RSI is crossing above the 60 level, a classic sign of bul
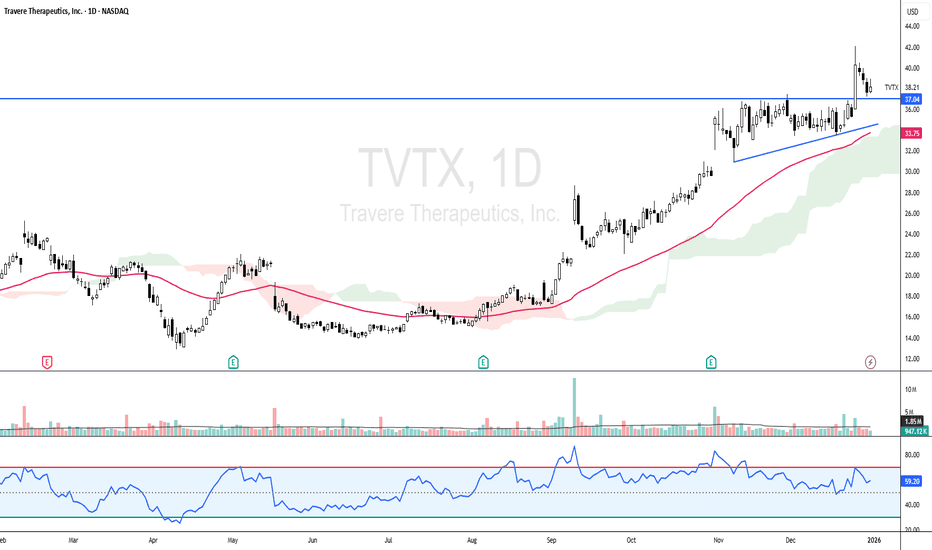
TVTX - Breaks a 10-Year High – A New Chapter BeginsTVTX - CURRENT PRICE : 38.21
TVTX has made a major technical breakout by moving above its 10-year high at $37.04, a level last seen in August 2015. This move places the stock firmly into price discovery, meaning there is no nearby historical resistance overhead. Importantly, the breakout is holding, with the previous resistance now acting as strong support, a key sign of a healthy and sustainable uptrend.
Looking back, the 24 December breakout can be viewed as an ascending triangle breakou
Next bullish pattern target for gold is at $8,195After my smaller timeframe gold chart played out to an exact T with absolute precision, I decided I woud zoom out to try and find the enxt possible pattern and breakout target. I am on the log chart here and we can see how on the long timeframes on log chart, the gold chart is just a series of bullflags. Of which the one with the longest flag pole we have just recently broken up from, when taking a measured move of that flagpole shown here with the tan trendline, and placing it at the breakout p
USDJPY rallies on BOJ's "dovish hike": Is 158.00 next target?USDJPY is surging past 156.00 despite the BOJ raising rates to 0.75%, the highest level since 1995. This classic "buy the rumour, sell the fact" reaction is fuelled by Governor Ueda's cautious guidance, signalling no rush for further hikes. A lack of commitment to a neutral rate path has kept the carry trade alive.
Key drivers
"Dovish hike" Reaction : The BOJ raised rates to 0.75% as priced in, but Governor Ueda emphasized a "data-dependent" approach with "no pre-set path," disappointing ha
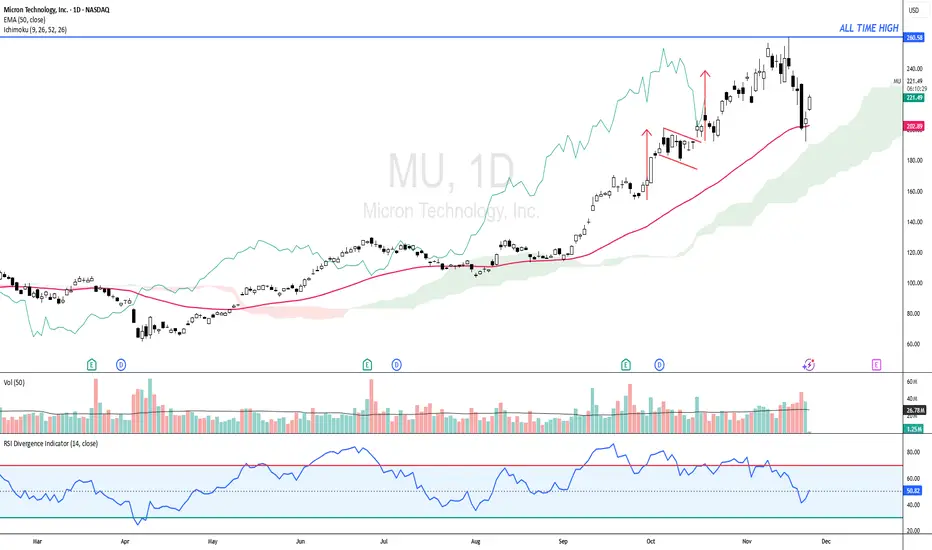
MU – Trend Still Intact, EMA50 Bounce SetupMU - CURRENT PRICE : 220.00 - 222.00
Technical Reasons (Bullish Bias)
1️⃣ Price retesting strong dynamic support
Price is holding above the 50-day EMA, which has acted as support throughout the uptrend. Pullback into EMA50 often forms a bullish continuation point.
2️⃣ Price still above the Ichimoku Cloud
Price is trading above the cloud, meaning long-term trend remains bullish. The cloud is thick — showing strong trend support. Latest pullback is testing the top of the cloud, usually a high-
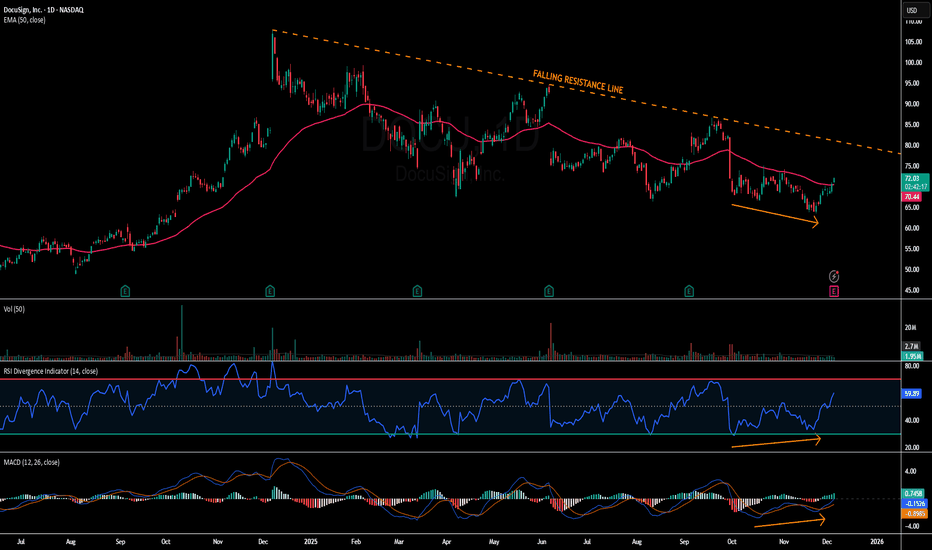
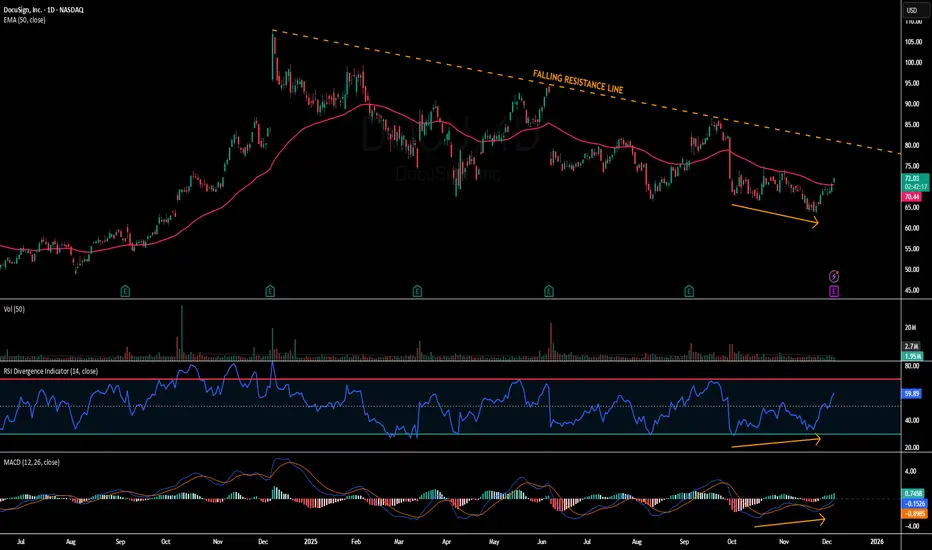
DOCU - Trendline Resistance in FocusDOCU - CURRENT PRICE : 71.87
Short-term outlook for DOCU is bullish as price moves above the EMA50, supported by RSI holding above 50 and bullish divergence in both RSI and MACD (look at orange arrows). Momentum continues to improve with a MACD bullish crossover, positioning DOCU for a move toward the long-term downtrend line. First target is $79 near trendline resistance, with a potential extension to $85, while $65 remains the key support and invalidation level.
ENTRY PRICE : 70.00 - 71.87
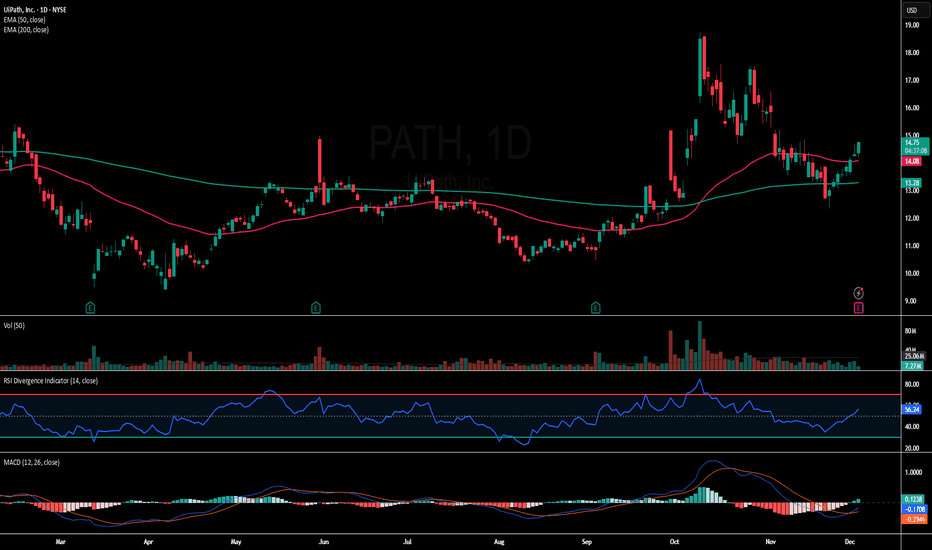
PATH - Price Reclaims 50-EMA and 200-EMAPATH - CURRENT PRICE : 14.50 - 14.70
PATH is gaining traction after reclaiming both the 50-EMA and 200-EMA, signalling a shift back into short-term bullish momentum 📈. Price strength is supported by rising RSI and an improving MACD cross, suggesting buyers are regaining control.
🔥 Bullish Points
Price reclaimed 50-EMA and 200-EMA
RSI trending above 50 → bullish momentum returning
MACD turning positive with increasing histogram
Volume uptick on recent green candles = buyers active
ENTRY
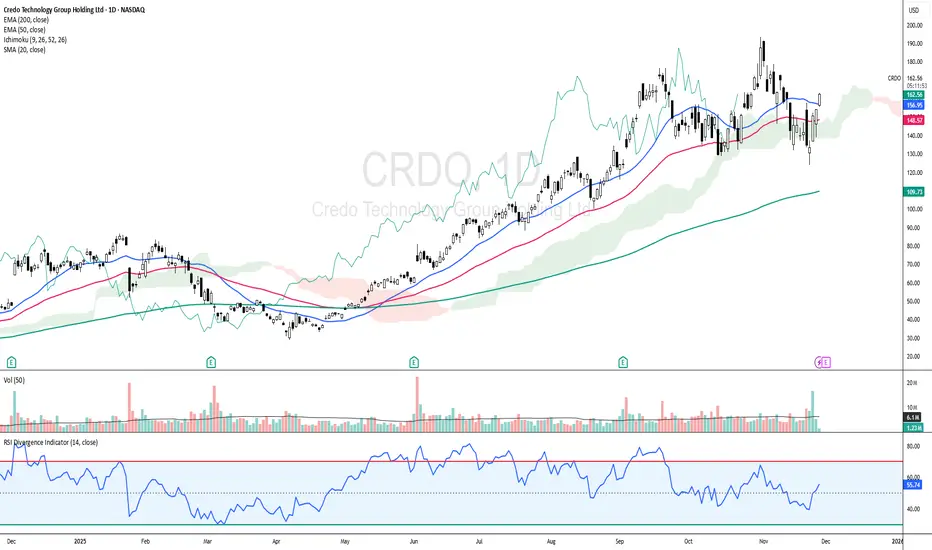
CRDO: Cloud + EMAs Aligning for Upside ContinuationCRDO - CURRENT PRICE : 162.95
CRDO is showing a bullish reversal setup as price rebounds and closes back above the EMA50 while holding firmly above the Ichimoku Cloud , signaling the major trend remains intact. Momentum is improving with RSI rising above 50 and not yet overbought, supported by increasing volume on the recent bullish white candlestick.
Today’s move above the 20-day SMA adds a positive layer to the short-term trend structure. Short term targets are 175.00 and 185.00 while s
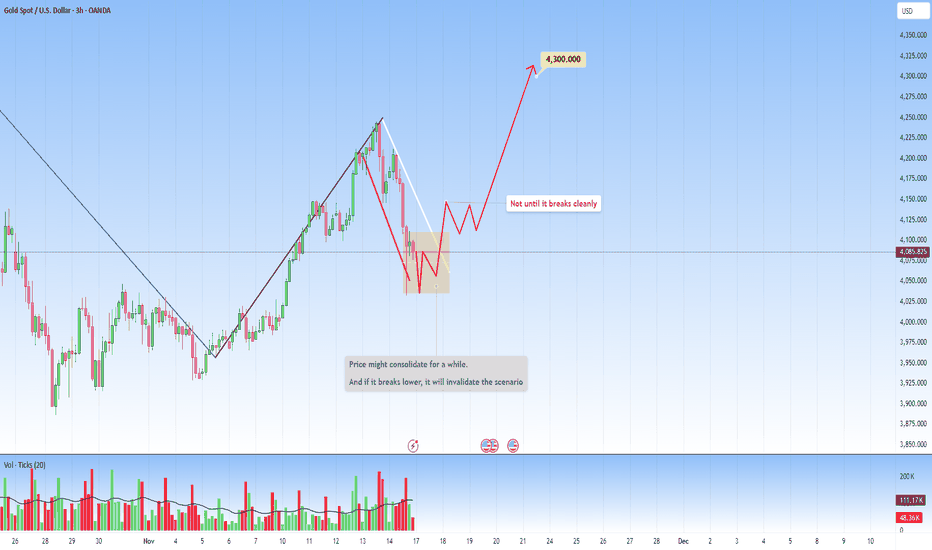
XAUUSD: Double Flag Setup, but with a "Warning"Things could get interesting this week.
In my previous analysis, I pointed out a big flag structure, with a smaller flag forming on top of it. But for the bullish scenario to actually happen, that second flag needs to break to the upside with strength…
THE PROBLEM? This retracement is already deeper than I’d personally like to see in a healthy bullish flag. The deeper it pulls back, the more it signals uncertain buyers, and this can create a DOMINO effect. When buyers can’t defend higher leve
btc finds 200 ema support, whats next?As I have been posting in these "Ideas" for the past few weeks about market direction and where the price for BTC will go. It now has come to pass where the 200 EMA has been tested and support has been found, It however has not generated any relief among buyer sentiment unable to push price above the previous days close leaving the digital asset to continue to bleed out and cause positions from all the 93k Bulls to liquidate.
Its a shame people cannot make the connection that the only way
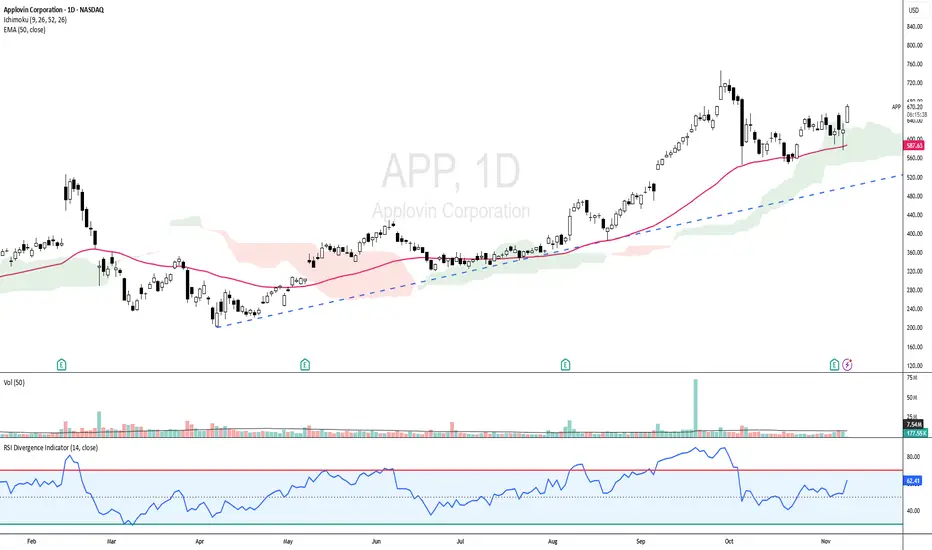
APP - UPTREND STILL INTACT!APP - CURRENT PRICE : 670.00 - 674.00
APP is showing strong bullish momentum as the price trades above the 50-day EMA and ICHIMOKU CLOUD , indicating a sustained uptrend. The RSI is in bullish territory but not yet overbought, indicating room for further upside. With the current setup, the stock has potential to retest its all-time high area if momentum continues.
ENTRY PRICE : 670.00 - 674.00
FIRST TARGET : 727.00
SECOND TARGET : 770.00
SUPPORT : 50-day EMA
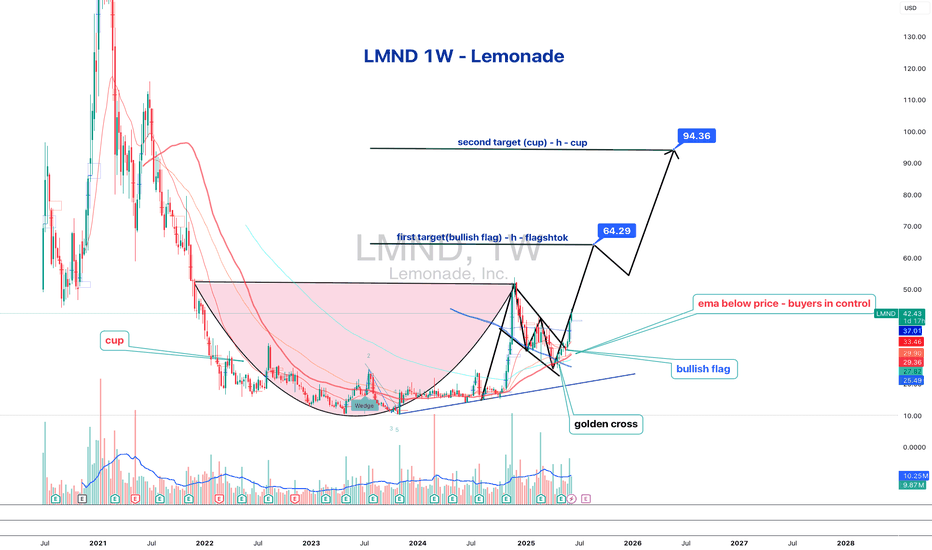
Lemonade Inc.: Breakout in Motion — Cup, Flag, and No BrakesLemonade Inc. (LMND) is accelerating after a clean breakout from a textbook cup with handle pattern, where the handle formed as a tight bullish flag. The breakout occurred around $32, and since then, price action has been sharp, controlled, and uncorrected — currently trading at $42.42 with buyers clearly in charge.
On the fundamental side, LMND is moving through a recovery phase: operational losses are narrowing, revenue is stabilizing, and the company is aggressively leveraging AI to automate
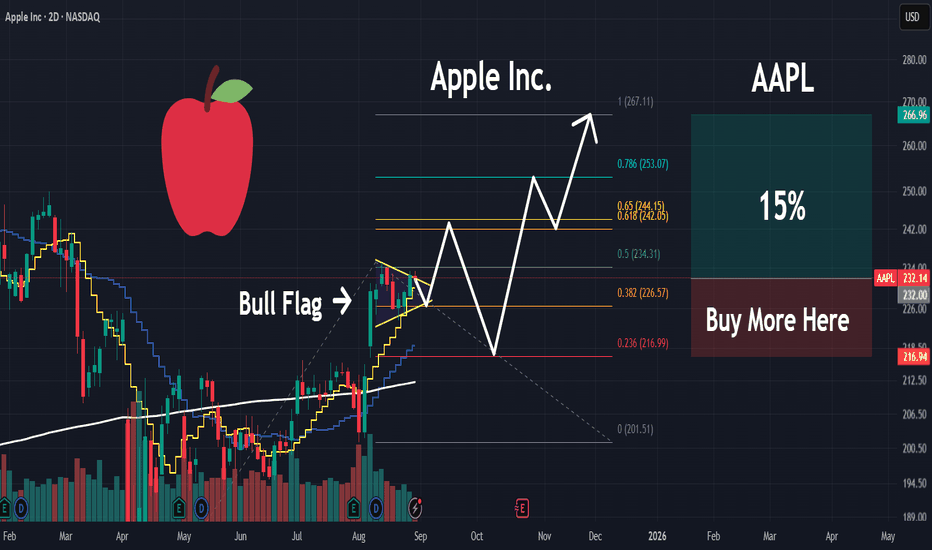
AAPL | Money will Rotate into this MEGA CAP | LONGApple, Inc. engages in the design, manufacture, and sale of smartphones, personal computers, tablets, wearables and accessories, and other varieties of related services. It operates through the following geographical segments: Americas, Europe, Greater China, Japan, and Rest of Asia Pacific. The Americas segment includes North and South America. The Europe segment consists of European countries, as well as India, the Middle East, and Africa. The Greater China segment comprises China, Hong Kong,
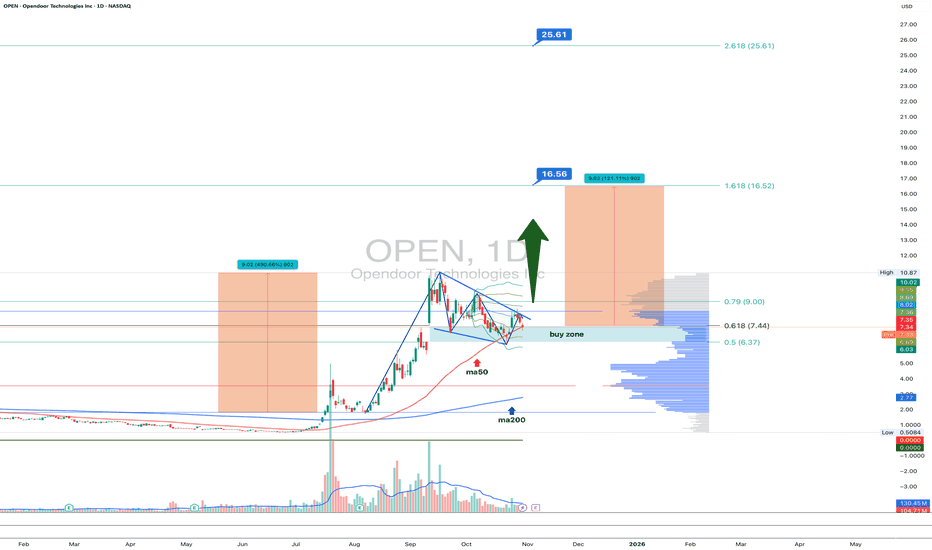
OPEN 1D - Flag Ready for Takeoff?On the daily chart, Opendoor Technologies (OPEN) is forming a clean bullish flag - a consolidation phase following a massive +400% rally since spring 2025. Price action remains tightly contained within the pattern, with strong support from the MA50 and the 6.3–7.4 buy zone, aligning with the 0.618 Fibonacci retracement.
Technically , the setup looks mature: MA50 is trending upward, MA200 sits far below, and volume contraction hints at a breakout ahead. The first target sits at $16.50 (1.618 ex
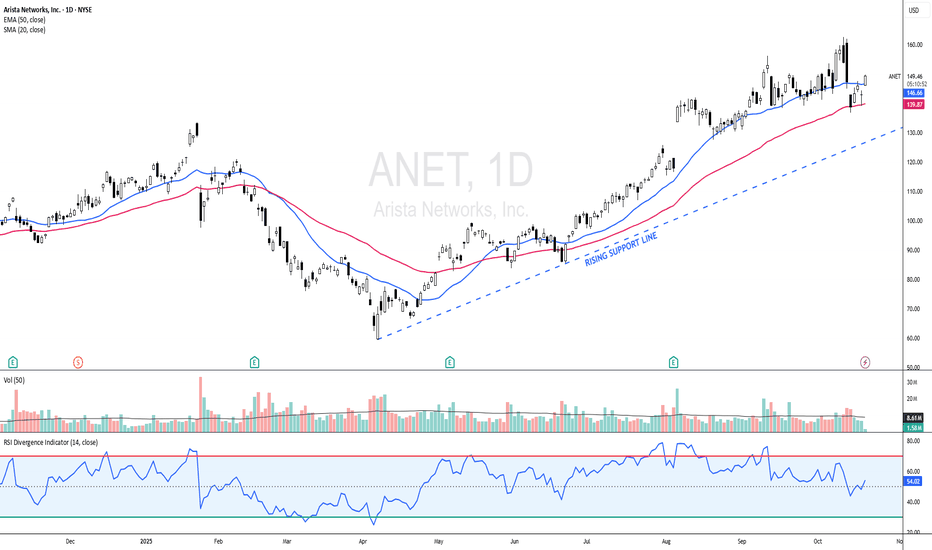
ANET - Rebounds from EMA 50ANET - CURRENT PRICE : 148.00 - 149.00
Technical Rationale:
1. Rebound from Key Moving Average Support
The stock price has rebounded strongly from the 50-day EMA, which has acted as a dynamic support level throughout the uptrend. This rebound indicates renewed buying interest at a technically significant area.
2. Bullish Momentum Confirmation
ANET has crossed above the 20-day SMA, suggesting a short-term shift back to bullish momentum after a healthy pullback. This crossover reflects improvi
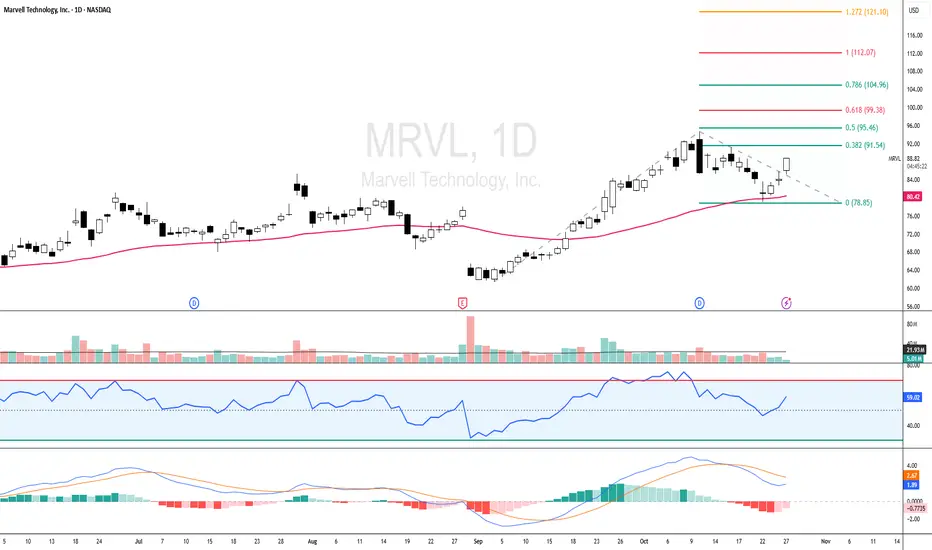
MRVL - RSI Back Above 50, Eyes Fibonacci Targets at 99 and 112MRVL - CURRENT PRICE : 86.00 - 88.00
MRVL is showing early signs of bullish continuation after finding support near the 50-day EMA and rebounding with positive momentum. The price structure remains healthy as it trades above the EMA 50, suggesting the medium-term trend is still intact.
Key Technical Highlights :
1) Price Above EMA 50
The stock price is holding above the EMA 50, showing that the uptrend remains valid and buyers are still in control.
2) RSI Above 50 and Not Overbought
RSI has
Got The GUTS For Stocks? Fractyl Health, Inc. Prints A Bull FlagNASDAQ:GUTS has printed a Bull Flag and with Price making a Retracement to the 50% Fibonacci Level @ $1.28, the Consolidation Phase of Price should be coming to and end!
This could mean its time to Buy Stock in Fractyl Health, Inc!
Once able to Breakout of the Descending Channel of the Flag, Price on Fractyl could keep pushing up!!
Currently the Analyst 1 Yr Price Target is set for $6.76, almost a 400% gain!
The company is also making great strides in weight loss study's and obesity gene
GLong
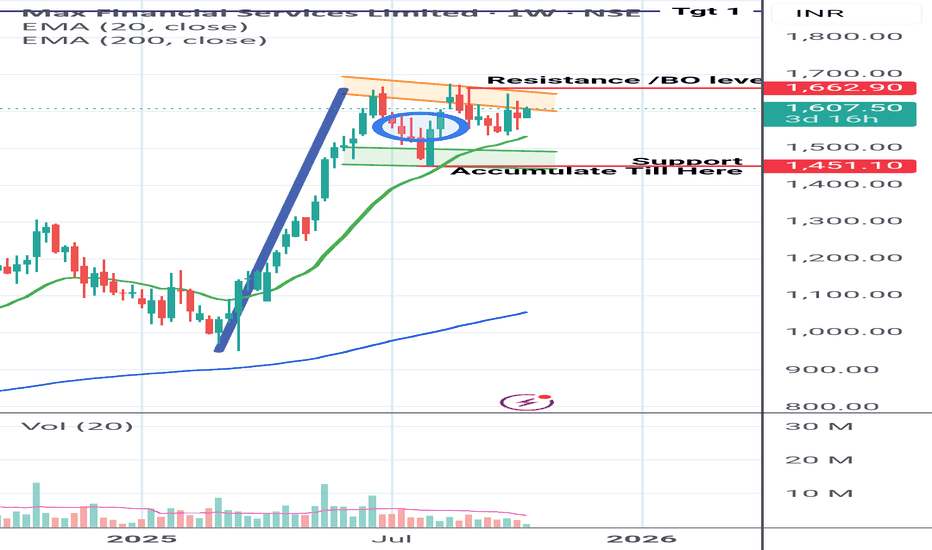
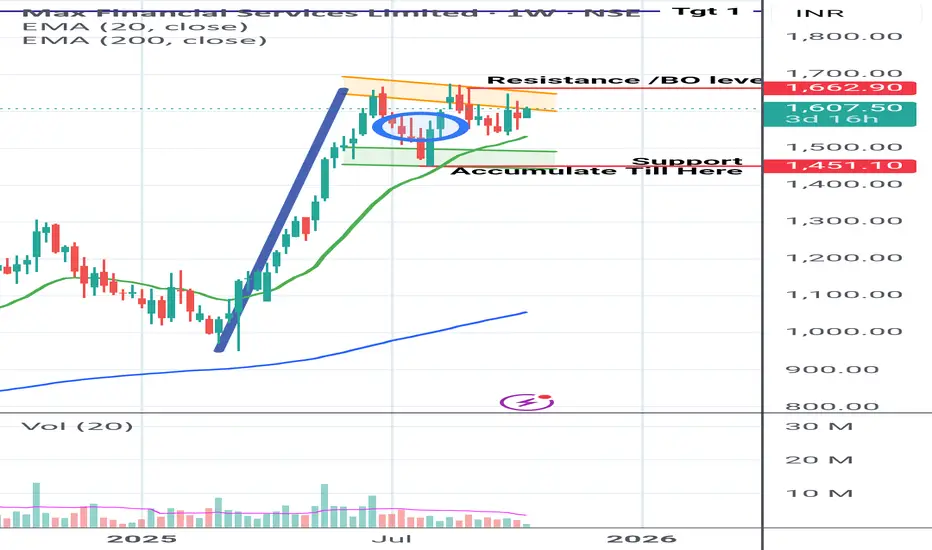
Max Financial going to serve Big# Fresh Pick
Date 13/10/25
MAX FINANCIAL SERVICE
Pattern Observed : Bullish Flag Pattern formation 🐮🇮🇳. Near Breakout stage.
On Confirmation of the breakout, we can see a good rally.
Targets/ Breakout /Support are marked in Chart.
Shared it for Reference purpose based on chart pattern.