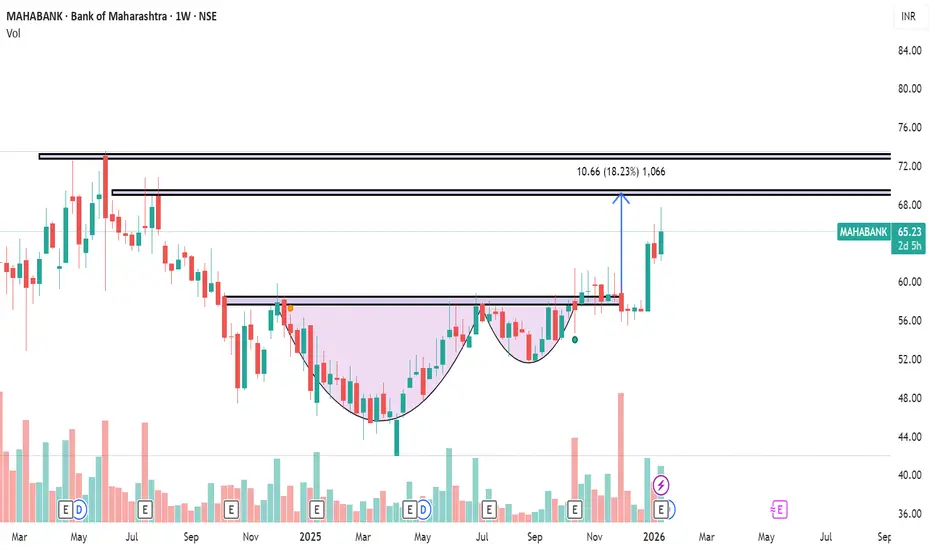
Cup And Handle
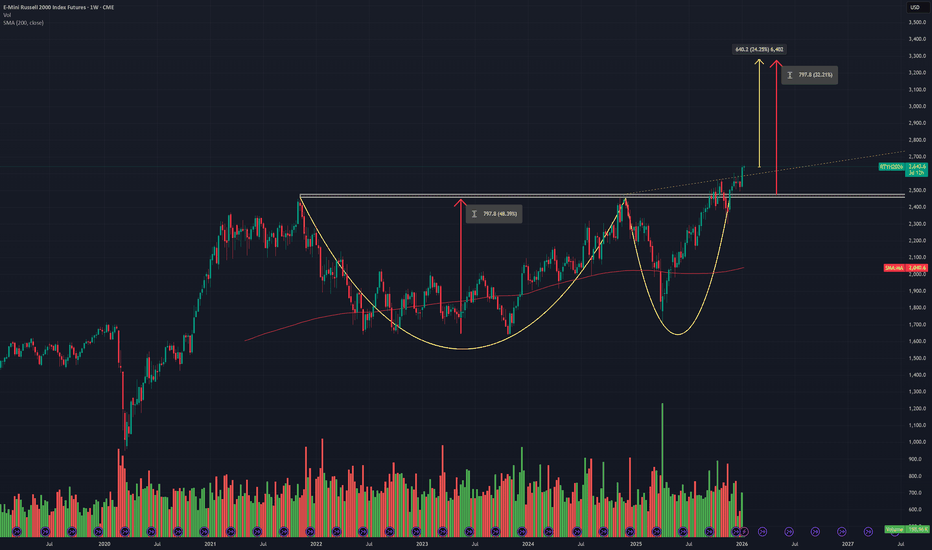
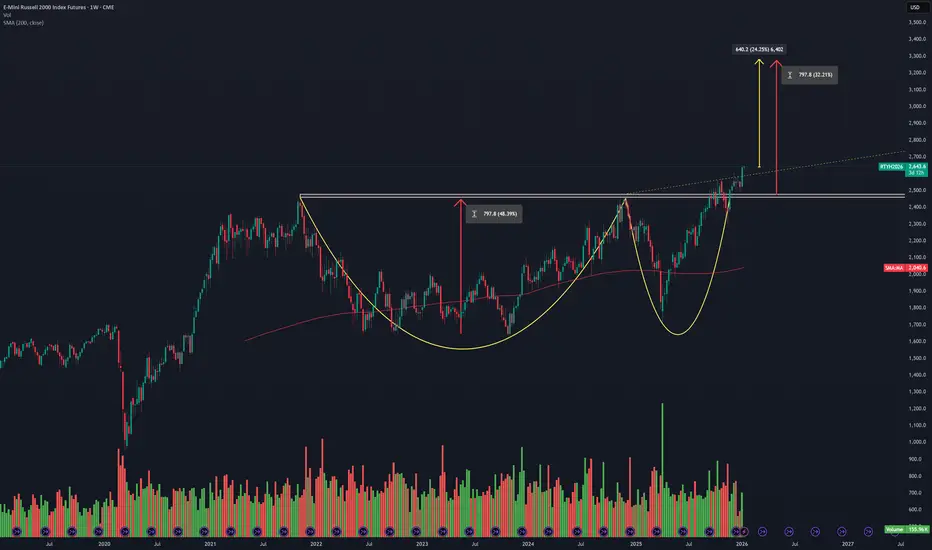
RTY / IWM Weekly: Cup & Handle Projection to $3280A classic Cup and Handle formation has developed on the weekly chart of the [b ]Russell 2000 (RTY) ; this structure is also visible on the IWM ETF.
My target is based on the depth of the Cup, which projects a measured move to $3280 . This represents a potential 24% upside from current prices.
Not Financial Advice. For educational purposes only.
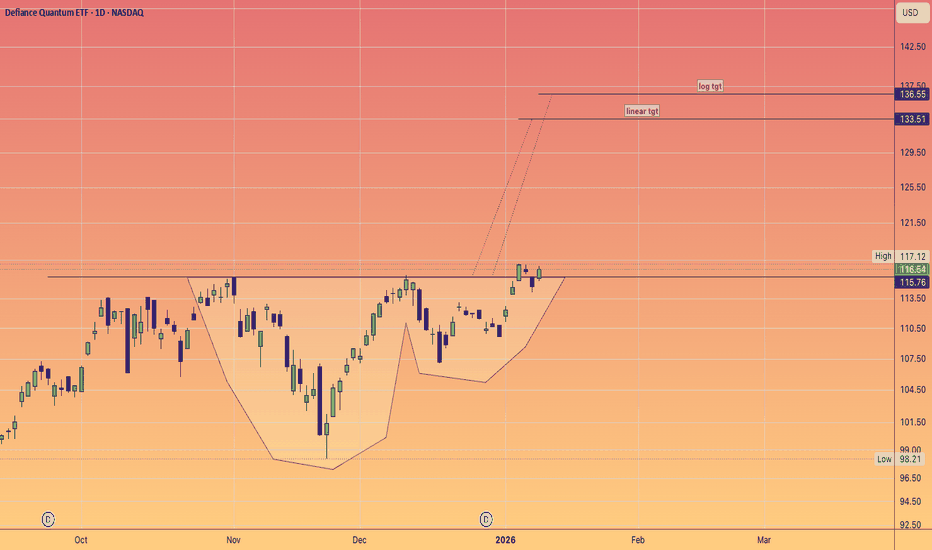
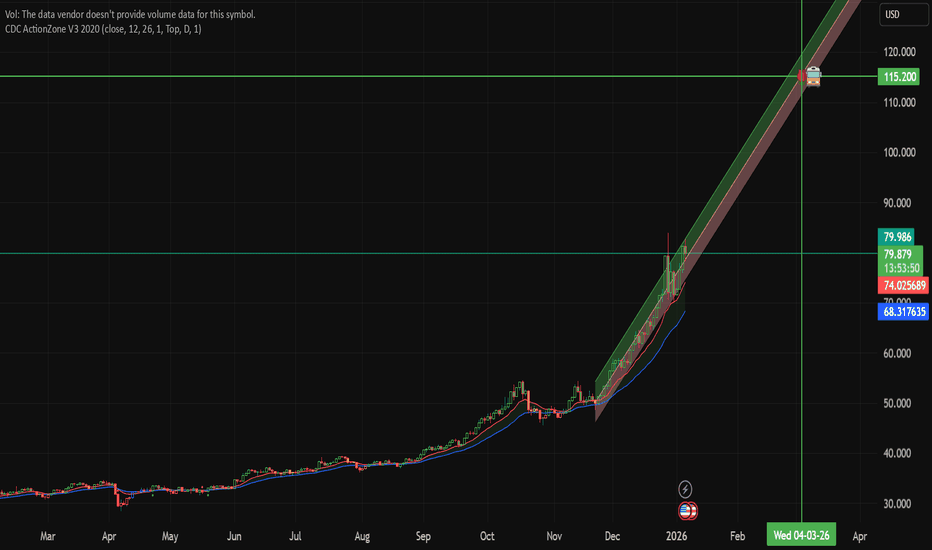
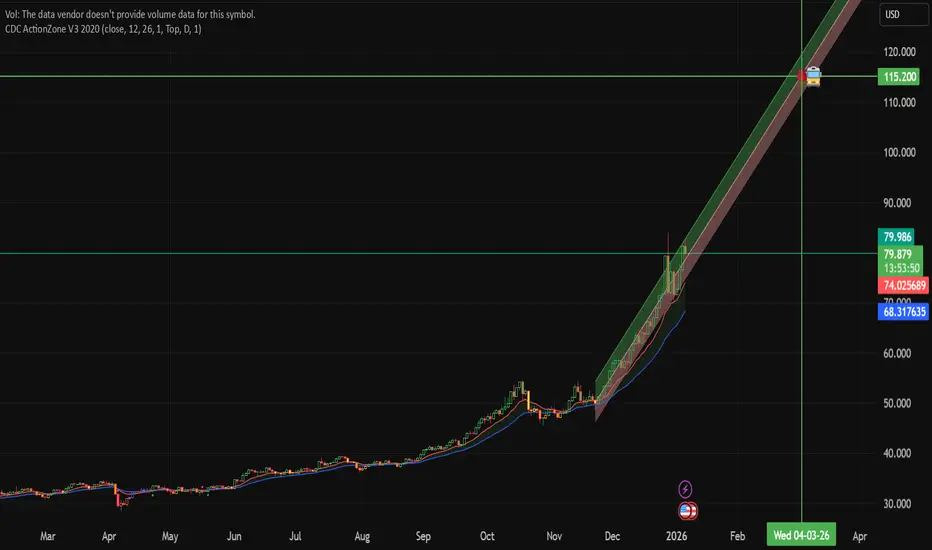
Quantum Leap: $QTUM Continuation Pattern has triggered.The Defiance Quantum ETF (QTUM) is showing a classic bullish continuation pattern after a spectacular 2025. Following a sharp rally, the price has been consolidating in a tight range near its 52-week high of $117.12.
The Technical Setup: We are seeing a clear consolidation phase—likely a cup and handle / or continuation inverse head and shoulders Both have the same price objective—just above the 50-day moving average ($114.36).
This 'pause' in the trend is healthy and suggests that the previous uptrend is ready to resume.
FUNDAMENTAL DRIVER:
2026 is being labeled a potential 'inflection year' for the industry.
IBM is targeting quantum advantage by the end of this year with its 120-qubit Nighthawk processor, while IonQ aims for systems up to 256 qubits.
Diversified Exposure: Unlike betting on a single stock, QTUM holds 84 different companies, spreading risk across hardware, software, and machine learning leaders like Microsoft, Alphabet, and NVIDIA.
Massive Market Growth: Analysts estimate the quantum computing market could grow from $0.8 billion in 2025 to over $1 billion in 2026, with some projections suggesting a nearly $2 trillion value creation potential by 2035.
Sustained Inflows: The ETF has seen net AUM growth of over $2.39 billion in the last year, proving that institutional capital is rotating heavily into this sector.
What's your take? Is the quantum sector ready for another parabolic move?
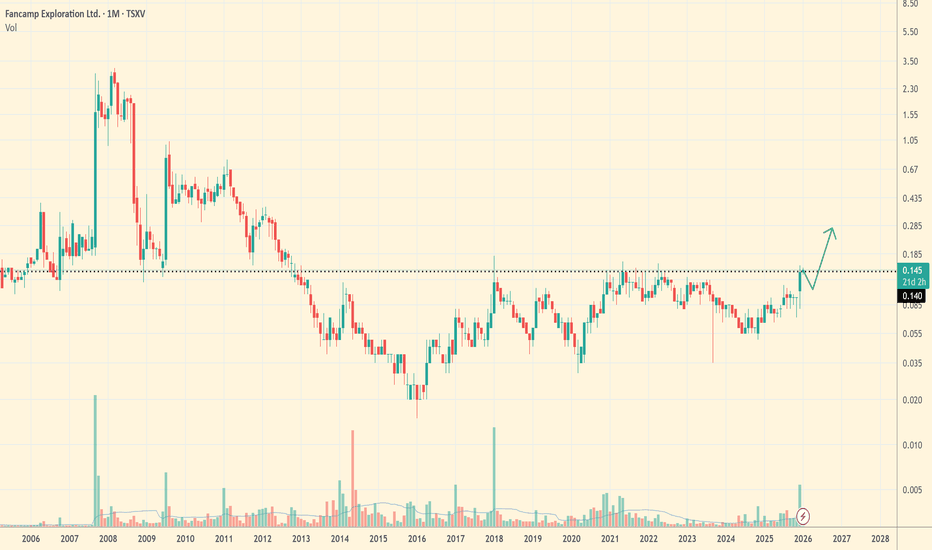
Fancamp Exploration – Asset-Backed Spin-Out SetupFancamp has announced a strategic spin-out of all its core exploration assets into a new company, Goldera Exploration Ltd. Existing FNC shareholders will receive Goldera shares pro-rata, with no change to their Fancamp holdings.
The transaction will be completed via a court-approved plan of arrangement and is targeted for Spring 2026. No record date has been announced yet, meaning the spin-out window remains open pending the Information Circular.
Post spin-out, Fancamp becomes a cash-flow and royalty vehicle, holding:
>$20M in marketable securities (dividend-generating)
$34.5M secured note in Ontario’s Ring of Fire (~$2M annual interest)
A diversified royalty portfolio, including up to $40M in future production payments and titanium exposure
At current levels, cash and securities alone approach the company’s market cap, leaving the secured note, royalties, Ring of Fire leverage, and spin-out optionality largely unpriced.
This is not a typical junior explorer trade, but a balance-sheet-backed asymmetric setup with a clearly defined corporate catalyst ahead.
Not investment advice. Do your own due diligence.
CHYM: From IPO Laggard to 2026 Leadership?Chime Financial is currently at a critical technical and fundamental inflection point, moving from a high-growth "disruptor" to a potentially profitable "mainstream" financial partner for millions of Americans. A
fter raising its 2025 revenue guidance to a range of $2.16B to $2.17B, the company has demonstrated resilient 29% year-over-year growth fuelled by its expanding Chime Card credit product and high "attach" rates among its 9.1 million active members.
The bullish narrative is further bolstered by a $200 million share repurchase program and a proprietary processing platform, ChimeCore, which has helped expand adjusted EBITDA margins to 5% as of late 2025.
Technically, as the stock clears its 200-day moving average of $25.23, it is breaking out of a textbook consolidation "Handle". With top-tier analysts like Goldman Sachs and B. Riley recently raising price targets to $30 and $35 respectively, the "Dragon's Tail" for this setup appears aimed at a return to the $40–$45 zone, representing the stock's post-IPO high-water mark.
$AES: Powering the AI Revolution with a Cup & Handle BreakoutThe Bull Case Description
Technical Setup: The Cup and Handle Breakout AES has spent the last several months building a large, rounded "Cup" base, followed by a tight, downward-sloping "Handle" that has successfully stayed in the upper half of the pattern.
Fundamental Bull Case: The "AI Power" Catalyst
Data Center Dominance: AES is the #1 global seller of renewable energy to corporations. It currently has 8.2 GW in signed power purchase agreements (PPAs), specifically targeting the exponential power needs of AI hyperscalers.
Clean Energy Pivot: The company is on track to triple its renewables capacity by 2027 and exit the majority of its coal generation by the end of 2025. This makes it a primary beneficiary of the "Clean, Firm, and Fast" power demand shift.
Financial Stability: Despite a higher debt-to-equity ratio, AES offers a strong 4.9% dividend yield and is projected to see an 8.4% EPS increase in 2026.
Institutional Support: High-tier analysts like Argus and Morgan Stanley have recently upgraded the stock to "Buy," citing its leadership in battery storage and energy transition.
The Verdict: AES represents a rare combination of Deep Value (P/E of ~9.0) and High Growth (AI energy demand). When the technical "Handle" breaks, the institutional rotation into "Energy for AI" should provide the fuel for a multi-month rally.
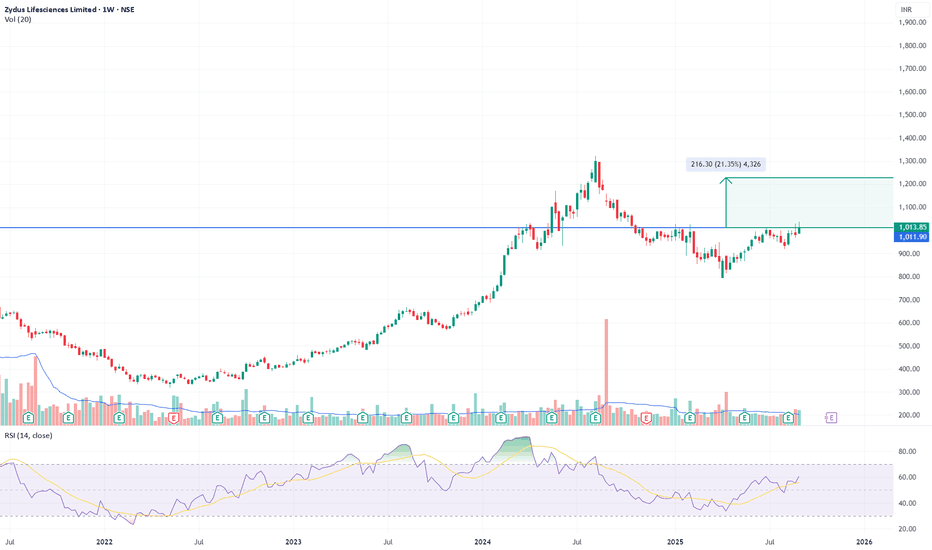
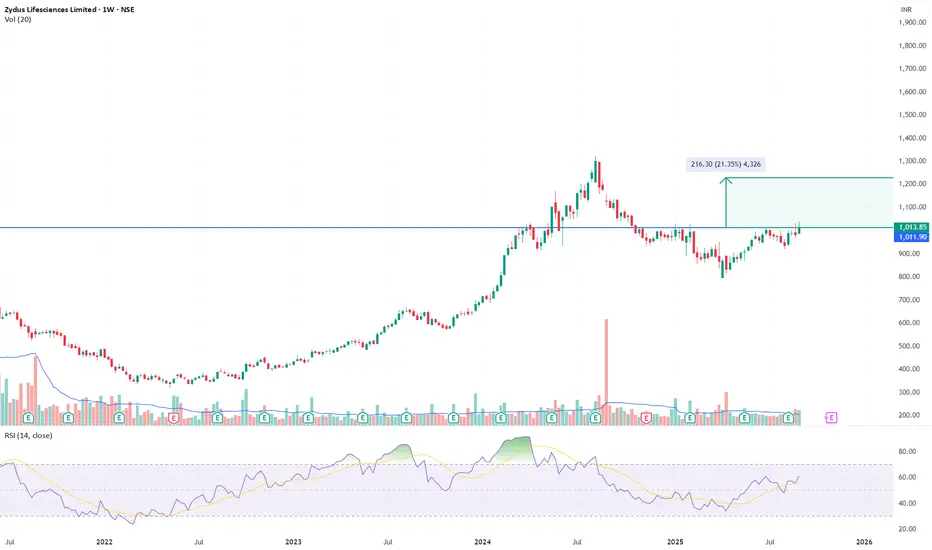
Zydus Lifesciences – Weekly Breakout Watch, Targeting 1,200Chart Context (Weekly)
Multi-year horizontal resistance around 1,020 tested repeatedly since 2022.
Strong weekly candle now approaching this zone with above-average volume (7.15M vs 5.01M).
RSI climbing ~60, momentum building without overbought conditions.
Setup
Base formation since late 2024 after a deep correction.
Breakout above 1,040 on a weekly close confirms structural reversal.
Measured move from base points to ~1,200 (~20% upside).
Levels
Breakout trigger: Weekly close > 1,040.
Upside potential: 1,150–1,200.
Risk management: Structure invalid below 960.
Bias: Medium-term swing; breakout confirmation needed for follow-through.
Disclaimer: This analysis is for educational purposes only and does not constitute investment advice. Please do your own research or consult a financial advisor before making trading or investment decisions.
CRUDE OIL (WTI): Bullish Movement Confirmed
WTI Crude Oil will likely continue rising
after a liquidity grab below the underlined horizontal support.
A consequent cup & handle pattern formation provides a strong
bullish confirmation.
Goal will be 57.41
❤️Please, support my work with like, thank you!❤️
I am part of Trade Nation's Influencer program and receive a monthly fee for using their TradingView charts in my analysis.
Moderna reversal? I sadly didn't post this from over the weekend (although I have receipts elsewhere), but Moderna showing some interesting reversal signs. Clear base formed over the last year, looking to form the potential backside of a pretty large cup. What's more interesting to me is the volume profile, with the shaded box showing almost double the average volume from the year prior when it was taking it's tumble. This coincides with a rising RSI and MACD despite the stock essentially remaining "flat" for the last year. Nothing is certain, but certain things can occur with the right checkmarks, and there is bullish signs. the 10% pop today certainly helps. No entry, but will be watching for a possible before $40.
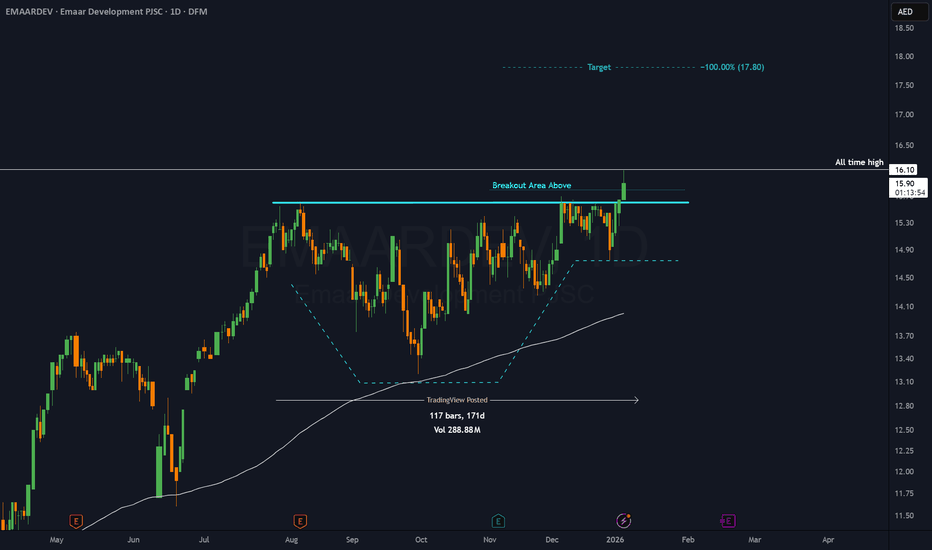
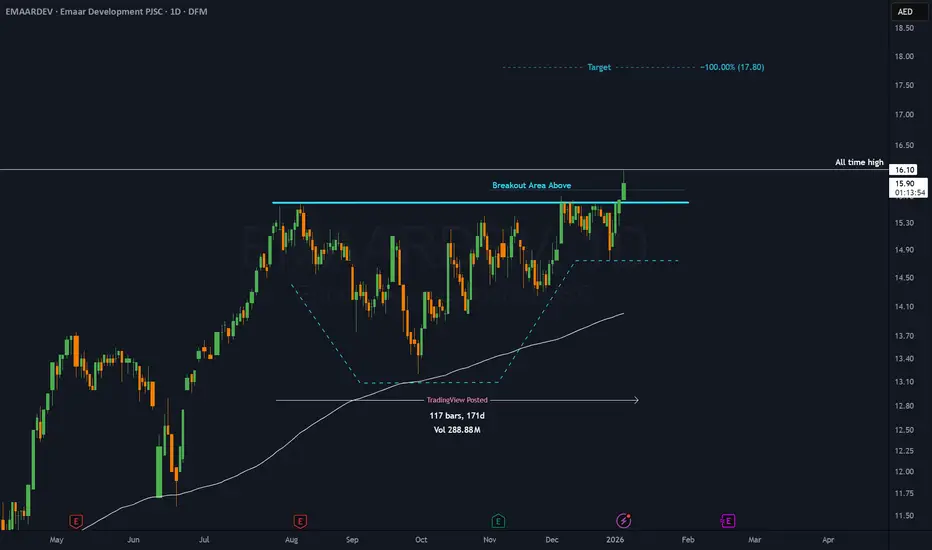
EMAARDEV - 4 months CUP & HANDLE══════════════════════════════
Since 2014, my markets approach is to spot
trading opportunities based solely on the
development of
CLASSICAL CHART PATTERNS
🤝Let’s learn and grow together 🤝
══════════════════════════════
Hello Traders ✌
After a careful consideration I came to the conclusion that:
- it is crucial to be quick in alerting you with all the opportunities I spot and often I don't post a good pattern because I don't have the opportunity to write down a proper didactical comment;
- since my parameters to identify a Classical Pattern and its scenario are very well defined, many of my comments were and would be redundant;
- the information that I think is important is very simple and can easily be understood just by looking at charts;
For these reasons and hoping to give you a better help, I decided to write comments only when something very specific or interesting shows up, otherwise all the information is shown on the chart.
Thank you all for your support
🔎🔎🔎 ALWAYS REMEMBER
"A pattern IS NOT a Pattern until the breakout is completed. Before that moment it is just a bunch of colorful candlesticks on a chart of your watchlist"
═════════════════════════════
⚠ DISCLAIMER ⚠
The content is The Art Of Charting's personal opinion and it is posted purely for educational purpose and therefore it must not be taken as a direct or indirect investing recommendations or advices. Any action taken upon these information is at your own risk.
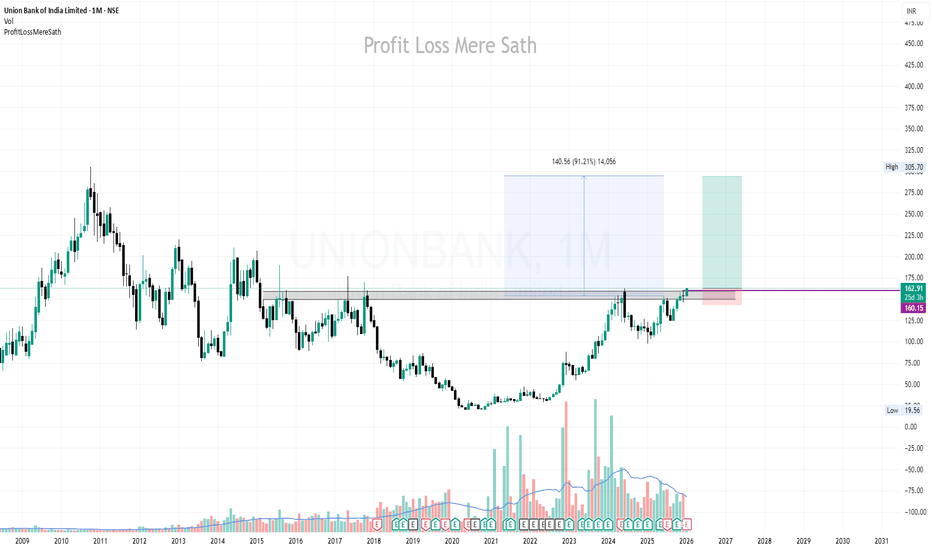
UNIONBANK | Buy @LTP | SL below 140 | 1st Target 210, 2nd 295******************************************************************************************************************
UNIONBANK | Buy @LTP | SL below 140 | 1st Target 210, 2nd 295
******************************************************************************************************************
Disclaimer (Please Read Carefully):
This is not investment advice. The stocks shared here are purely for educational and informational purposes. Please do your own research or consult with a financial advisor before making any investment decisions.
******************************************************************************************************************
Stock market में सिर्फ risk ही risk होता है। Market में survive करने का एक ही तरीका है, stop loss को पूरी discipline के साथ accept करना। अपनी capital को protect करने का इससे बेहतर कोई तरीका नहीं है।
मैं जो भी stock यहाँ शेयर करता हूँ, वो या तो मेरी existing holding में होता है, या फिर मैं उसी level पर fresh buying या add on करता हूँ जिसे मैं mention करता हूँ।
मैं हमेशा buy करते समय अपने system में stop loss ज़रूर लगा देता हूँ, और मेरे लिए stop loss, target से भी ज़्यादा important होता है।
Target achieve होने के बाद मैं पहले profit book करता हूँ और फिर retest या fresh breakout का इंतज़ार करता हूँ।
मैं सिर्फ breakouts पर buy करता हूँ, कभी भी support पर नहीं। और मैं resistance पर sell भी नहीं करता।
******************************************************************************************************************
The stock market involves risk, risk, and only risk. To survive in the market, accepting stop-loss with discipline and without hesitation. There is no other way to protect you capital.
Any stock I share is either already part of my existing holding or I take a fresh entry at the same level I mention. I always place the stop-loss in my system at the time of buying, and I give the highest importance to stop-loss more than the target. Once the target is achieved, I usually book profit once and then wait for either a retest or a fresh breakout.
I buy only on breakouts, never on supports. I also do not sell at resistance levels.
That is simply my trading style.
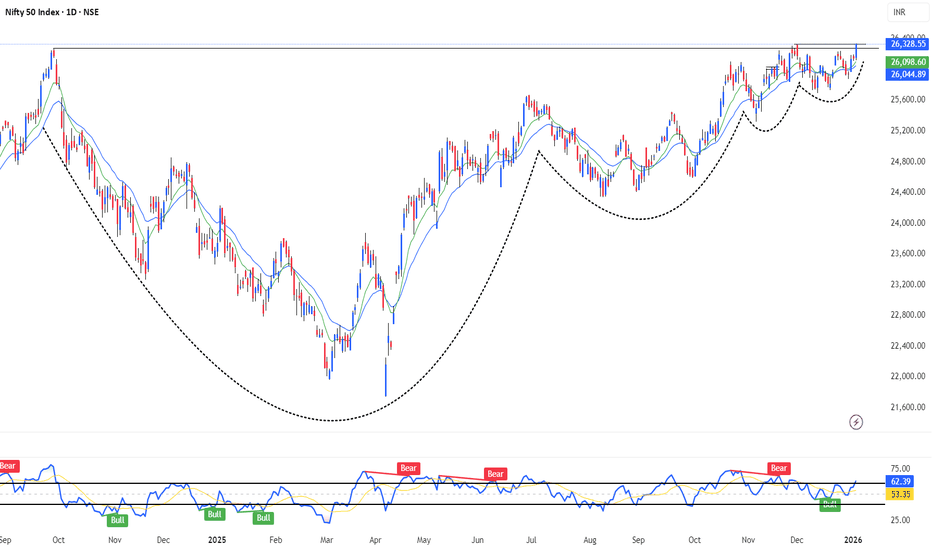
NIFTY 50 | Structural Trend Update (Daily Timeframe)
Pattern Context
NIFTY 50 is shaping a large Cup & Handle–like structure on the daily chart.
The cup reflects a rounded base formation after a corrective phase, followed by a steady recovery.
The handle phase is developing as a shallow consolidation near prior highs, indicating absorption rather than distribution.
Trend & Structure
Price continues to hold above rising short- and medium-term moving averages, maintaining a higher high–higher low structure.
Pullbacks remain controlled and time-based, not price-destructive — a key trait of healthy trends.
Momentum Insight (RSI)
RSI has shifted into a bullish range (above 50) and is sustaining higher troughs.
No major bearish divergence observed during recent consolidations, suggesting momentum is pausing, not reversing.
Market Behaviour
Repeated tests near the resistance zone are being met with range compression, highlighting supply absorption.
Volatility remains contained, which typically precedes directional expansion.
Process-Based View (No Prediction)
As long as price respects the handle low / rising structure, the broader trend remains constructive.
Any directional follow-through should be evaluated only after confirmation, not anticipation.
Risk Framework
Trend validity is intact until structure breaks, not until opinions change.
Decision-making remains rule-driven, not headline-driven.
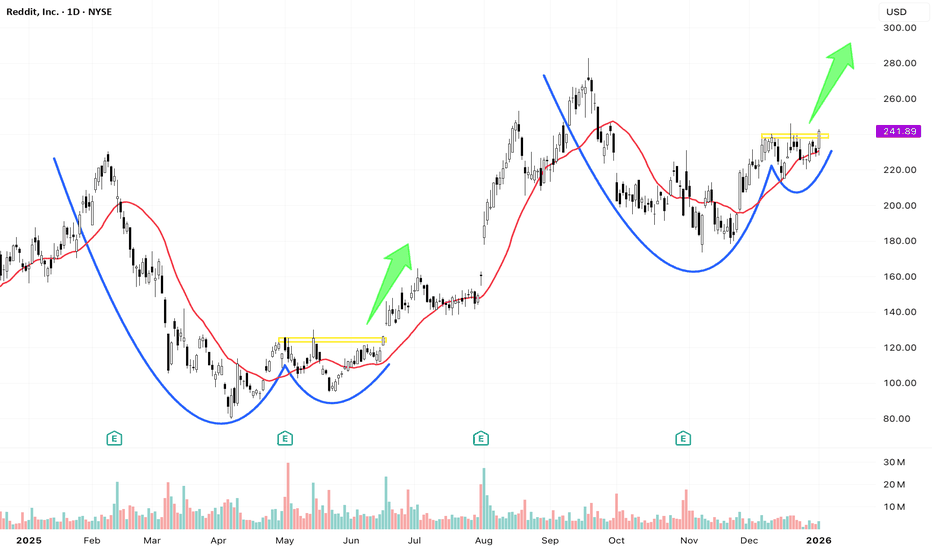
Technical Analysis is All About Pattern RecognitionNYSE:RDDT : The Cup-and-Handle and VCP Breakout Setup
RDDT has established a clear "rhythm": after a two-month consolidation, it consistently reclaims the 20-day SMA (Red Line), followed by a volatility contraction phase where the price stops making new lows.
The stock just completed a Cup-and-Handle pattern, forming a 1 to 1.5-month Volatility Contraction Pattern (VCP) before breaking out, signaling that supply has been fully absorbed.
The recent +5.23% move on expanding volume successfully cleared the $240 psychological level, marking a fresh breakout from the consolidation high. This "breakout within a base" confirms that the trend is ready for its next leg higher.
Summary: By reclaiming the SMA 20 and breaking out of the tightest part of the pattern, RDDT is showing a high-probability continuation signal. As always, manage your risk and keep stops below the previous swing low.
Copper at a Historic Barrier
Short-Term Technical Analysis (Weeks to Months)
On the monthly timeframe, copper futures are testing a major multi-decade resistance, represented by the purple trendline connecting historical highs. Price reaction here will define the medium-term direction.
The rising moving average (orange line) below price confirms strong trend momentum, though the stretched distance suggests a potential short-term pullback.
Bullish Short-Term Scenario:
A confirmed monthly close above $5.80 would validate a breakout and trigger an accelerated bullish phase.
Bearish Short-Term Scenario:
Failure to hold above resistance could result in a corrective pullback without damaging the primary uptrend.
Short-Term Target:
$6.40–$6.80
Short-Term Stop-Loss:
Monthly close below $4.90
Long-Term Technical Analysis (1–5 Years)
From a macro perspective, copper shows strong signs of entering a commodity supercycle. A successful breakout above this long-term resistance could lead to price discovery.
Bullish Long-Term Scenario:
Sustained trading above the historical trendline opens the door to much higher multi-year targets.
Bearish Long-Term Scenario:
Rejection from resistance may lead to a prolonged consolidation rather than a deep bear market.
Long-Term Target:
$8.00–$9.00
Long-Term Stop-Loss:
Structural breakdown below $4.20
Fundamental Analysis (Brief)
Copper is often called “Dr. Copper” due to its ability to signal global economic health:
• Massive demand from EVs, renewable energy, and electrification
• Chronic underinvestment in new mining supply
• Rising consumption in China, India, and emerging markets
• High sensitivity to economic cycles and monetary policy
If the global green transition continues, copper could be one of the biggest winners of the next decade.
Final Takeaway
Copper is sitting at a historic inflection point:
• Break and hold above resistance → powerful multi-year uptrend
• Rejection → healthy pullback and strategic re-entry opportunities
This is a chart that long-term investors should watch very closely.
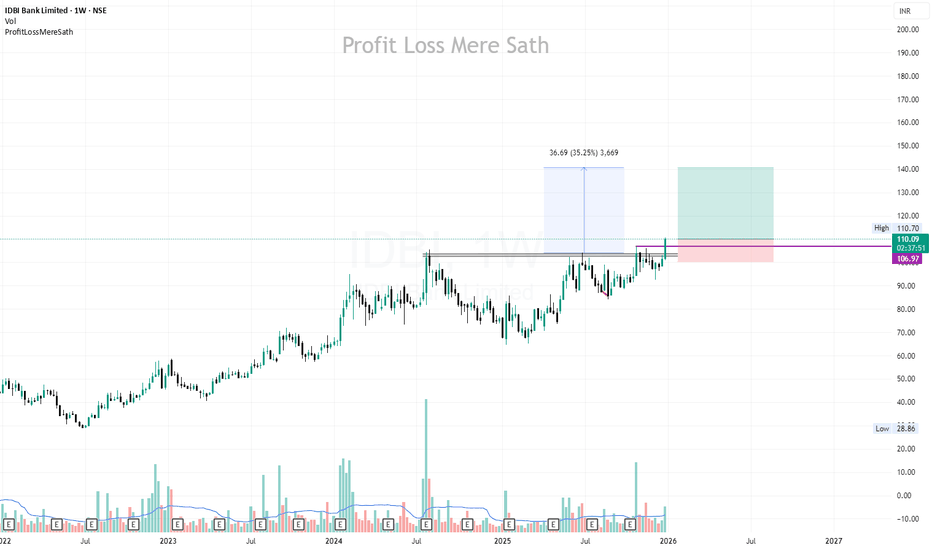
IDBI | Buy @LTP | SL below 100 | 1st Target 140Disclaimer (Please Read Carefully):
This is not investment advice. The stocks shared here are purely for educational and informational purposes. Please do your own research or consult with a financial advisor before making any investment decisions.
******************************************************************************************************************
Stock market में सिर्फ risk ही risk होता है। Market में survive करने का एक ही तरीका है, stop loss को पूरी discipline के साथ accept करना। अपनी capital को protect करने का इससे बेहतर कोई तरीका नहीं है।
मैं जो भी stock यहाँ शेयर करता हूँ, वो या तो मेरी existing holding में होता है, या फिर मैं उसी level पर fresh buying या add on करता हूँ जिसे मैं mention करता हूँ।
मैं हमेशा buy करते समय अपने system में stop loss ज़रूर लगा देता हूँ, और मेरे लिए stop loss, target से भी ज़्यादा important होता है।
Target achieve होने के बाद मैं पहले profit book करता हूँ और फिर retest या fresh breakout का इंतज़ार करता हूँ।
मैं सिर्फ breakouts पर buy करता हूँ, कभी भी support पर नहीं। और मैं resistance पर sell भी नहीं करता।
******************************************************************************************************************
The stock market involves risk, risk, and only risk. To survive in the market, accepting stop-loss with discipline and without hesitation. There is no other way to protect you capital.
Any stock I share is either already part of my existing holding or I take a fresh entry at the same level I mention. I always place the stop-loss in my system at the time of buying, and I give the highest importance to stop-loss more than the target. Once the target is achieved, I usually book profit once and then wait for either a retest or a fresh breakout.
I buy only on breakouts, never on supports. I also do not sell at resistance levels.
That is simply my trading style.
Educational Insight | Bajaj Auto (Technical Observation)
Bajaj Auto — where structure aligns with momentum
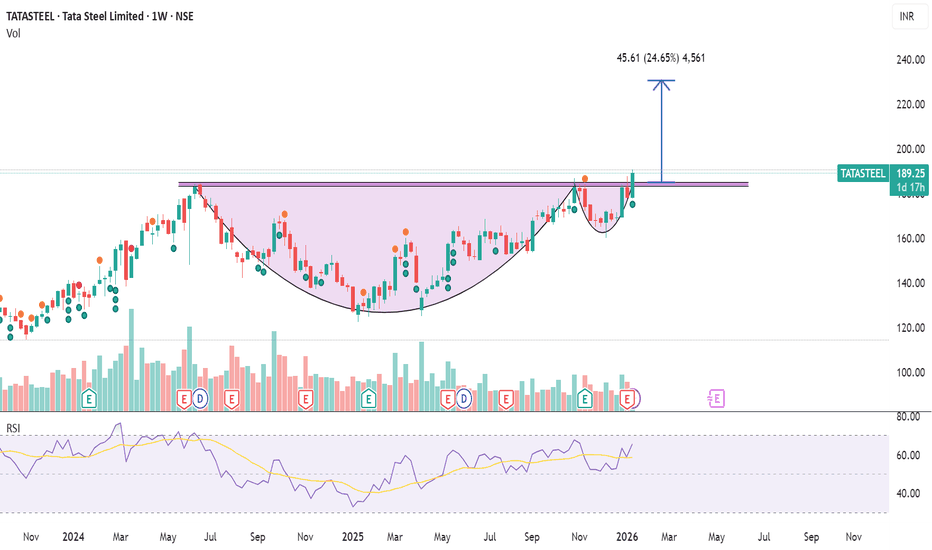
- Price has resolved above a long weekly cup range, followed by a decisive RSI regime shift above 60 after nearly a year.
- Daily structure supports the move with higher highs and sustained strength above key levels.
- Trend transitioning from range → expansion.
TREET Technical OutlookTREET has completed a Cup pattern on the daily chart and is now forming a horizontal accumulation zone. Price has moved above the ascending uptrend trendline, indicating a strong rebound and potential continuation move. The structure remains higher-low based, and the overall trend looks bullish as long as price holds above trendline support.
Buying Plan:
• Buy: CMP 31.84
Stop Loss:
• 30.50 (below trendline & range support)
Targets:
• TP1: 34
• TP2: 37
• TP3: 39.50
Technical Notes:
After consolidation, price shows a strong probability of bouncing from trendline support. RSI is in the neutral zone, leaving room for further upside. A breakout above 34 with volume expansion can accelerate bullish momentum. Partial profit booking is recommended at each target. The trend remains bullish unless 30.50 is violated.
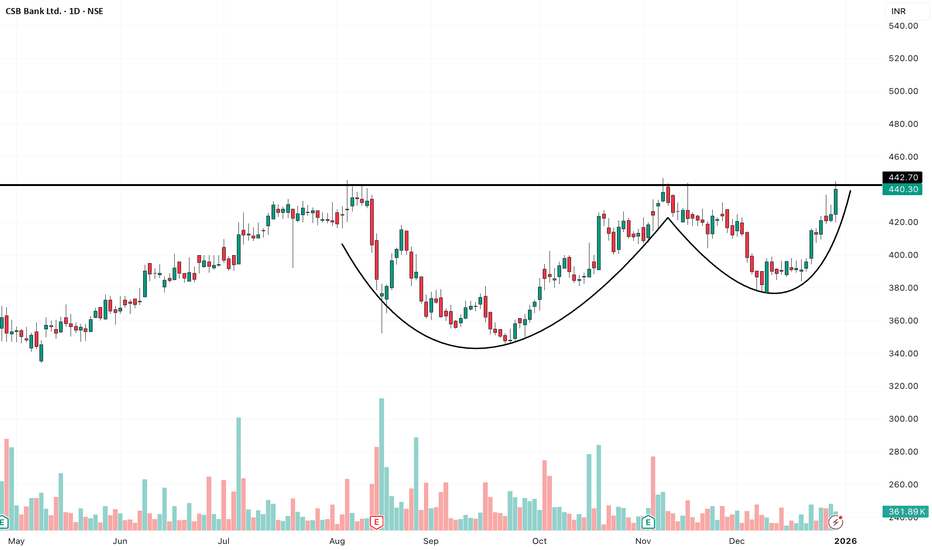
CSB Bank Ltd – Cup Pattern Breakout (Daily | NSE)🔹 Structure: Rounded base / cup formation after decline → accumulation phase, higher lows forming.
🔹 Pattern: Cup-like structure with rim resistance near ₹440–443, typically leads to sustained trend moves.
🔹 Breakout Status: Strong bullish candle near resistance, close near highs → momentum building.
🔹 Volume: Expansion on recent up-move, confirms participation, no exhaustion signs.
🔹 Resistance: ₹442–445.
🔹 Support (post-breakout): ₹430–435.
🔹 Major Support: ₹395–400.
🎯 Targets: ₹470–480 (pattern projection), ₹510–520 (positional extension).
📈 Probability: Upside continuation 62–68%, consolidation 20–25%, rejection 10–15%.
📊 Bias: Bullish (Swing / Positional), best if price sustains above ₹440 on daily close.
❌ Invalidation: Daily close below ₹425 weakens setup, below ₹400 pattern fails.
🧠 Summary: Rounded base breakout near key resistance with volume support; holding above ₹440 favors higher targets.