Long
Long
 Long
Long
 Long
Long
 Short
Short
XAU/USD 1H — Trendline Break + Fib Rejection + Possible Gap FillGold is showing signs of a potential bearish correction after a strong bullish push from the June 11 low.
The market made an aggressive move higher into the 4,355 area, creating a clean bullish structure with higher highs and higher lows. During that rally, price respected the rising blue trendline as dynamic support.
However, price has now broken below that ascending trendline, which is the first major sign that momentum may be shifting.
After the break, gold attempted to stabilize, but it is now reacting around the Fibonacci retracement zone. The key levels I’m watching are:
0.382 Fib: 4,329
0.50 Fib: 4,334
0.62 Fib: 4,339
0.79 Fib: 4,346
The most important rejection area is between 4,334–4,339, where the 0.50 and 0.62 Fib levels line up with previous structure and the broken trendline retest area.
From an Elliott Wave perspective, the bullish move from the June 11 low into the June 16 high may have completed a 5-wave impulse. If that count is correct, the current movement could be developing into an A-B-C correction.
Possible wave outlook:
Wave A: Initial drop from the high into the 4,312 area
Wave B: Corrective bounce into the Fib/retest zone
Wave C: Potential continuation lower toward the gap/FVG area
The market also left a noticeable imbalance/FVG below from the strong bullish displacement move. Because of that, gold may try to come back down and fill the gap/rebalance that area before deciding on the next major move.
The downside levels I’m watching are:
Target 1: 4,301
Target 2: 4,286
A clean break below 4,312 would strengthen the bearish continuation idea and increase the probability of price reaching into the gap-fill zone.
As long as price remains below the 4,334–4,339 Fib zone, my short-term bias remains bearish. If price reclaims 4,346 and pushes back toward 4,355, the bearish correction idea becomes weaker.
Bias: Bearish below 4,339
Confirmation: Break below 4,312
Targets: 4,301, then 4,286
Invalidation: Reclaim above 4,346–4,355
This setup is a strong example of how trendline breaks, Fibonacci retracements, Elliott Wave structure, and market gaps can align to create a clean trading idea.
@WrightWayInvestments
@WrightWayInvestments
@WrightWayInvestments
 Short
Short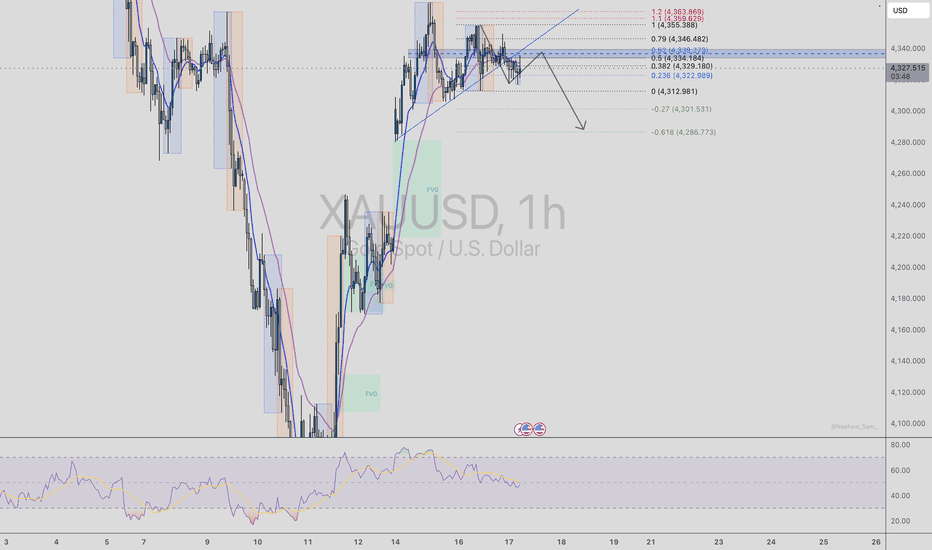
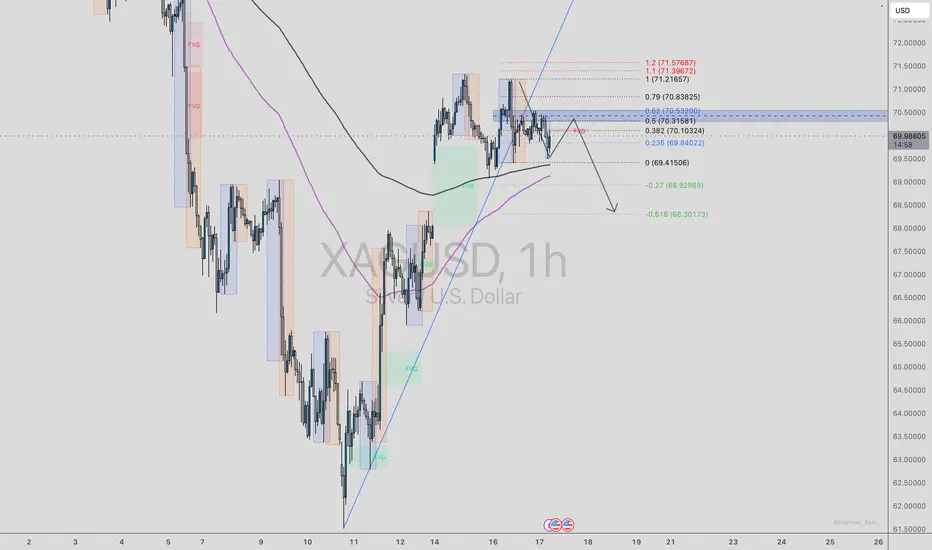
XAG/USD 1H — Trendline Break + Fib Rejection Signals Potential BXAG/USD has been in a strong bullish recovery from the June 11 low near the 61.50–62.00 area, pushing aggressively into the 71.21 region. During that move, price respected a clean ascending trendline and continued printing bullish structure with higher highs and higher lows.
However, the current 1H chart is showing early signs of a possible bearish shift.
Price has now broken below the ascending trendline, which was previously acting as dynamic support throughout the move higher. After the break, price attempted to retrace back upward but struggled inside the key Fibonacci retracement zone.
The major rejection area sits around:
0.382 Fib: 70.10
0.50 Fib: 70.31
0.618 Fib: 70.53
This zone also lines up with prior structure, a marked resistance/FVG area, and the broken trendline region. That gives the setup strong bearish confluence.
From an Elliott Wave perspective, the bullish move from the June 11 low into the June 16 high may represent a completed 5-wave impulse. If that count is correct, the current movement could be the beginning of an A-B-C corrective structure.
Possible wave outlook:
Wave A: Initial selloff from 71.21 into 69.41
Wave B: Corrective bounce into the 70.10–70.53 fib zone
Wave C: Potential continuation lower toward the fib extension targets
The key level to watch is 69.41. A clean break and close below this level would confirm a stronger bearish structure shift and open the door for continuation toward:
Target 1: 68.92
Target 2: 68.30
As long as price remains below the 70.53–70.83 area, my bias remains bearish. If price reclaims that zone and pushes back above 71.21, the bearish setup becomes invalidated.
Bias: Bearish below 70.53
Confirmation: Break below 69.41
Targets: 68.92, then 68.30
Invalidation: Reclaim above 70.83–71.21
This is a clean example of how trendline breaks, Fibonacci retracements, fair value gaps, Elliott Wave structure, and market structure can align to create a high-probability trading idea.
@WrightWayInvestments
@wrightwayinvestments
@wrightwayinvestments  Short
Short
Trent Ltd – Rounding Bottom Breakout Confirmed📈 Trent Ltd – Rounding Bottom Breakout Confirmed
📊 CMP: ₹3,003
🛑 Stop Loss: ₹2,600
🎯 Targets: ₹3,233 | ₹3,686
Trent has formed a rounding bottom pattern, indicating a potential long-term trend reversal. After completing the base formation, the stock entered a box consolidation phase, which helped absorb supply and build a stronger foundation.
A decisive breakout from this consolidation zone, supported by healthy volumes, suggests renewed buying interest and strengthens the bullish outlook. The combination of a rounding bottom followed by consolidation often acts as a powerful continuation setup.
📌 Trading Strategy:
Consider controlled position sizing to manage risk effectively.
Maintain a strict stop loss at ₹2,600.
Partial profit booking can be considered near ₹3,233, while a sustained move above this level may open the path towards ₹3,686.
Monitor volume expansion and price action for confirmation of breakout strength.
⚠️ This is a technical setup-based view and not investment advice. Always manage risk according to your trading plan.
⚠️ Clarification:
This is an independent analysis based purely on technical and market study. No part of Religare is involved in this view or recommendation.
📝 Important:
I am not responsible for any loss or profit incurred. I am not taking any fees for these views—just sharing my analysis for educational and informational purposes.
📉 Disclaimer:
Not SEBI-registered. Please do your own research or consult a financial advisor before taking any investment decision.  Long
Long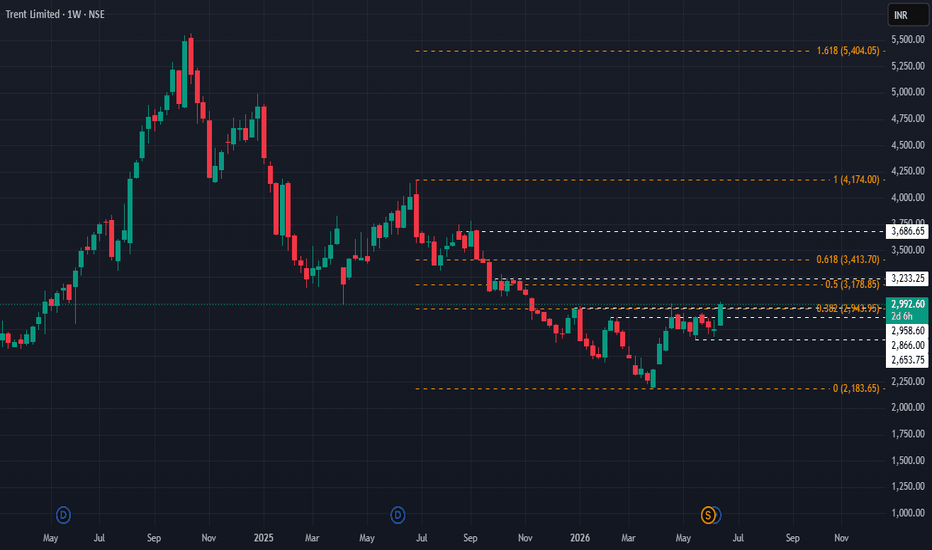
GOLD - Consolidation before growth. Positive background?ICMARKETS:XAUUSD is holding above $4,300 on Tuesday after pulling back from the six-day high of $4,369 reached during the previous U.S. trading session. The three-day rally has given way to consolidation, leaving room for further gains
Gold is currently in a phase of strong technical recovery, driven by a combination of geopolitical optimism and a reassessment of inflation risks. The market is entering the upcoming Federal Reserve meeting in a much more balanced position than it was immediately after the jobs report.
The market is awaiting two key events: the June 16–17 Federal Reserve meeting (including the updated dot plot and Chair Warsh’s press conference) and the official signing ceremony of the peace agreement in Geneva on June 19.
If the Fed’s dot plot proves less hawkish than the market expects and Friday’s signing ceremony confirms progress, gold could test 4426–4476 and continue higher. However, if Warsh confirms a high probability of further rate hikes in the second half of the year and the details of the agreement disappoint, gold may enter a corrective phase
Resistance levels: 4363, 4426, 4476
Support levels: 4306, 4268, 4246
A false breakout of 4363 is triggering a correction (the reaction remains weak), while gold continues to consolidate above the key support zone at 4300–4310. Fundamentally, the local backdrop is improving and providing support to the market. A rebound from the 4300 area could lead to a move toward 4426–4476
Best regards,
R. Linda Long 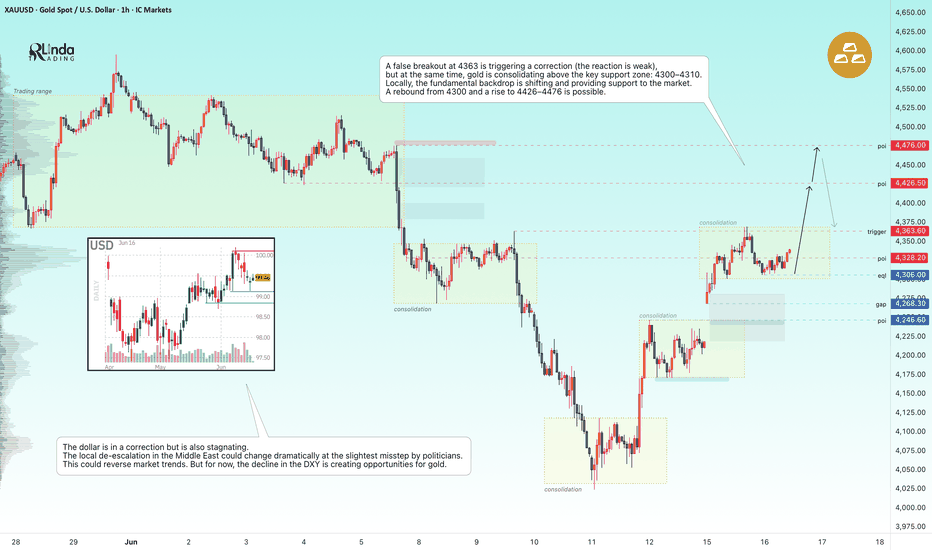
HYPEUSDT - Ready for the trend to continue BINANCE:HYPEUSDT.P continues to maintain its overall bullish trend and appears poised to resume its upward movement following the recent correction. Despite weakness in Bitcoin, the altcoin remains resilient and has a strong chance of retesting its all-time high.
After a period of consolidation during the corrective phase, the market is transitioning back into a rally phase and looks poised to continue higher. The coin continues to demonstrate notable relative strength, and in the medium term, it may challenge its all-time high. The broader weakness across the cryptocurrency market has had limited impact on HYPE, aside from the wave of negative news in early June that triggered panic and capital outflows.
The fundamental outlook for HYPE continues to improve, giving traders an opportunity to target the 70.0–75.0 range.
Resistance levels: 65.80, 70.0, 72.4
Support levels: 64.0, 62.40
Technically, the price remains in a bullish cycle. The key trigger is 65.800—a close above this level could open the door for the rally to continue.
Best regards, R. Linda  Long
Long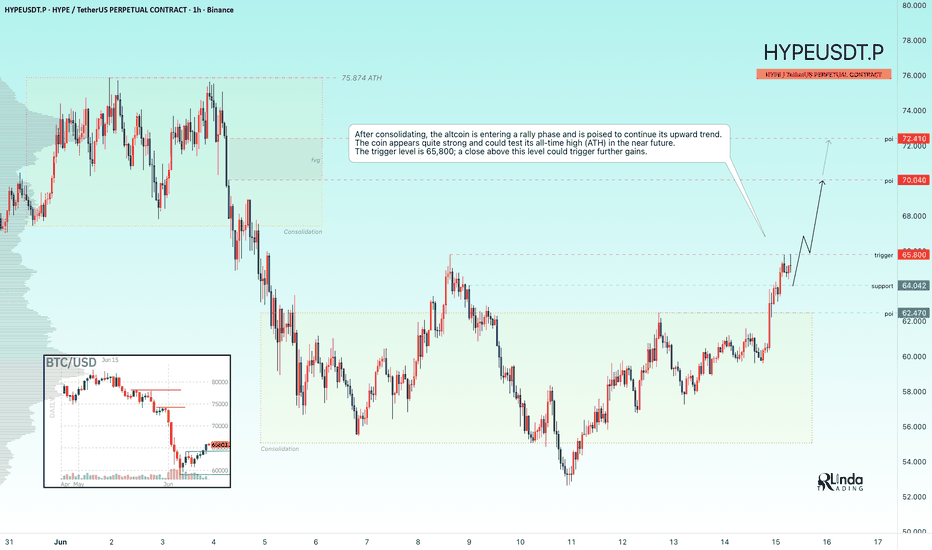
XAUUSD: Wave 5 Recovery Meets the Sell Zone
Gold is pausing after a strong three-day recovery, and price is now reacting around the 4,319–4,330 sell wave C zone. From Kelly’s view, the current structure suggests that the latest upside move may be entering the final part of wave 5, where the market needs confirmation before any further continuation.
The key idea is simple: gold has recovered strongly, but price is now testing a sensitive resistance area while macro uncertainty is rising again.
⟡ Market structure
Gold pushed higher after defending the lower base near 4,026–4,053, then built a clean bullish sequence towards the current resistance area. The recovery has been strong, but price is now slowing under the sell wave C zone, which makes this area important for the next directional decision.
The chart also shows Fibonacci reaction zones below price. If gold fails to hold above the current resistance, the market may correct back towards the 0.618 Fibonacci area near 4,243, then the 0.5 liquidity zone around 4,202.
➤ Key levels
◌ 4,319–4,330: sell wave C zone and current resistance
◌ 4,243: 0.618 Fibonacci buy scalping zone
◌ 4,202: 0.5 Fibonacci buy liquidity zone
◌ 4,109–4,120: lower target and deeper support
◌ Above 4,330: area where the sell wave C setup weakens
⌁ Elliott Wave view
From an Elliott Wave perspective, gold appears to be completing a short-term wave 5 recovery after the previous bullish structure developed from the lower zone.
Wave 1 started from the 4,026 area.
Wave 2 corrected into the lower base.
Wave 3 expanded strongly towards the upper range.
Wave 4 held above liquidity support.
Wave 5 is now testing the sell wave C resistance area.
If wave 5 finishes around the current zone and price prints bearish confirmation, gold may start an A-B-C corrective pullback towards 4,243 first, then 4,202 if selling pressure expands.
▸ Fundamental backdrop
Gold is pausing as traders become more cautious after the earlier optimism around the temporary US-Iran peace agreement and the reopening of the Strait of Hormuz started to fade.
At the same time, the market is watching the upcoming Fed decision closely. If the US Dollar continues trying to fill Monday’s bearish gap, gold may struggle to extend higher in the short term.
Geopolitical risk is still present, especially with tension around Israel and Lebanon, but the market is not treating the peace narrative as fully secure yet. That keeps volatility elevated and makes confirmation more important than chasing price.
▸ Trading scenario
Preferred scenario: wait for reaction around the 4,319–4,330 sell wave C zone.
Sell reaction zone: 4,319–4,330 if bearish confirmation appears
Stop loss: above the confirmed wave 5 high
Take profit 1: 4,243
Take profit 2: 4,202
Take profit 3: 4,109–4,120
Alternative scenario: if gold breaks above 4,330 and holds with strong acceptance, the wave 5 sell setup loses quality, and price may continue extending before forming a new structure.
⌁ Kelly’s view
For Kelly, this is not a clean place to chase the upside. The recovery has already travelled far, and price is now testing a zone where wave 5 may be close to completion.
The better approach is to watch how gold reacts around 4,319–4,330. If rejection appears, the market may shift from recovery into correction.
Gold is still holding its rebound.
But structurally, wave 5 may be approaching the point where sellers start testing control again.
Share your view below.
Short 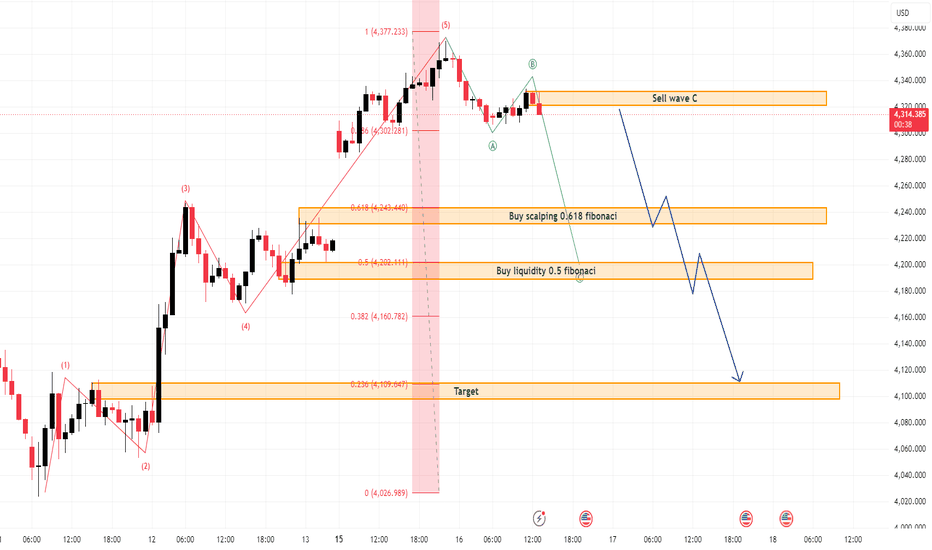
Gold Completes Impulse Cycle - Deep ABC Correction Underway?The Gold market (XAUUSD) kicks off the new trading week under intense bearish pressure, displaying a clean structural shift as sellers aggressively dominate the intraday momentum. Following a highly volatile week dictated by US CPI and PPI inflation data, market participants are experiencing a temporary macroeconomic data vacuum on Monday. Consequently, institutional desks (Smart Money) are driving the price action strictly based on technical order flow and liquidity rebalancing.
The market sentiment is actively shifting from last week's bullish momentum into a profit-taking phase, trapping late-stage breakout buyers as the price seeks a structural discount floor ahead of the upcoming sessions.
Based on the newly emerging Bearish ABC Corrective structure on the M30 timeframe, the core technical levels to monitor closely include:
Major Overhead Resistance (Wave 5 Peak): 4,335.403 – The definitive swing high that completed the previous bullish impulse cycle, now acting as the ultimate invalidation line for the bears.
Breakdown Checkpoint: 4,267.981 – A critical structural horizontal layer (Fibonacci 0.786) where temporary short-covering or minor consolidation could occur.
Immediate Target Area: 4,216.328 – The internal Fibonacci 0.618 level, serving as a primary structural inflection zone for early corrective targets.
Major Confluence Demand Zone (Potential Wave C Bottom): 4,184.792 – A highly significant institutional liquidity floor overlapping with the Fibonacci 0.5 retracement layer, expected to act as the ultimate battlefield for trend defense.
What is your take on this newly formed M30 corrective structure? Will Gold respect the 4,184.792 confluence demand zone to finalize Wave (C), or will the bulls defend the higher layers aggressively? Drop your technical perspectives and charts in the comments section below! Long 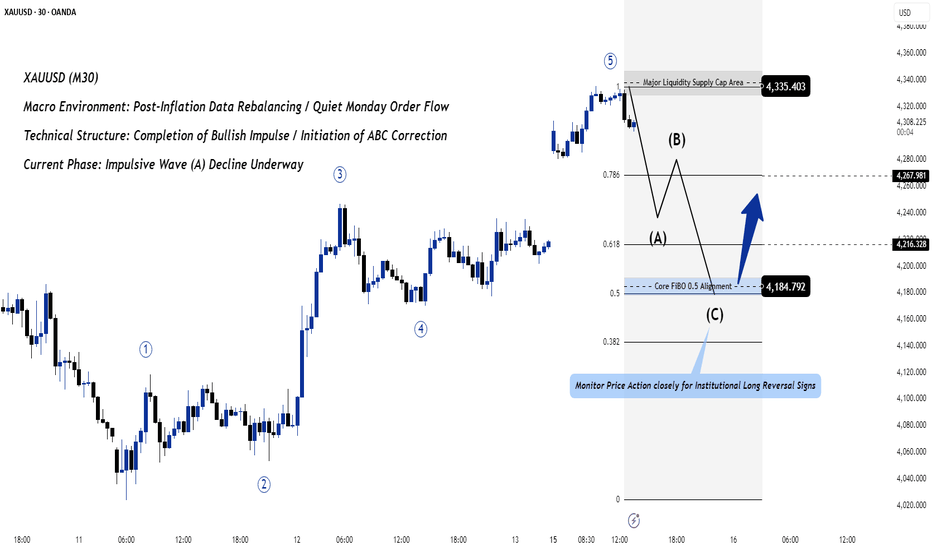
GOLD - Countertrend correction may continueICMARKETS:XAUUSD continues its correction amid a temporary pullback in the U.S. Dollar Index. Technically, this remains a countertrend move. All eyes are now on geopolitical developments and the upcoming Federal Reserve rate decision
Gold is caught between geopolitical support and intense macroeconomic pressure, compounded by the technical break below the 200-day SMA. Wall Street analysts continue to maintain a predominantly bearish outlook.
The U.S. dollar is currently correcting after a false breakout above the 100.0 level. Technically, however, the index remains in a bullish trend, which continues to weigh on gold amid ongoing geopolitical uncertainty.
Against the backdrop of both local and global bearish trends, the market is developing a countertrend corrective phase. The focus remains on the 4246–4170 range. Fundamentally, gold lacks strong support, although a local bullish reaction is currently visible. The market is targeting the 4325–4368 liquidity zone before a potential continuation lower
Resistance levels: 4246, 4315, 4347
Support levels: 4170, 4100, 4057
I expect the local bullish impulse to continue. Before extending higher, gold may retest the 4180–4170 area. A long squeeze could trigger an advance toward 4315–4347. However, a short squeeze around the resistance zone could increase selling pressure and lead to a decline toward 4170–4100.
Best regards,
R. Linda Short 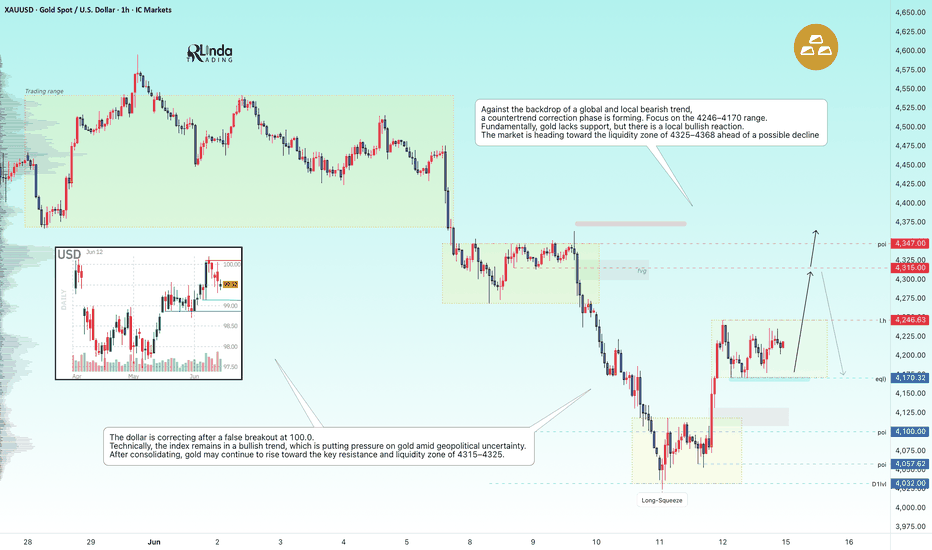
BTCUSD - Daily Outlook: Potential Rejection at the FVGCorrective Rally Into FVG Before Targeting Sell-Side Liquidity
BTCUSD remains bearish on the daily timeframe following the strong breakdown from the 82,000 high. The recent decline shifted market structure to the downside and confirmed that sellers currently control the broader trend. While price has staged a recovery from the 60,000 area, the move is currently viewed as a corrective rally rather than the start of a new bullish trend.
The key area to monitor is the Fair Value Gap (FVG) between 65,000 and 66,000. This imbalance was created during the impulsive sell-off and remains unfilled. Markets frequently revisit these areas to rebalance price inefficiencies before continuing in the direction of the dominant trend. As a result, the FVG becomes a high-probability zone for sellers to re-enter the market.
The preferred scenario is for BTCUSD to continue pushing higher into the FVG, attracting late buyers and drawing liquidity into the market. If price begins to show signs of exhaustion within this area, such as weaker bullish momentum, rejection candles, or a bearish market structure shift on lower timeframes, it would suggest that the corrective rally is losing strength and that sellers are regaining control.
A rejection from the FVG would support the continuation of the broader bearish trend and increase the likelihood of a move toward the sell-side liquidity (SSL) resting around 59,000. This level represents a significant liquidity objective beneath current price and is a natural target if bearish momentum resumes. Markets often seek liquidity below previous lows before considering a larger reversal, making the SSL a logical destination following a rejection from the imbalance zone.
From a market structure perspective, the current recovery remains valid while price is moving toward the FVG. However, unless buyers can achieve a sustained breakout above the imbalance area, the rally should be treated as corrective. The higher-probability setup remains a sell opportunity from the FVG, with the expectation that price will eventually seek the 59,000 SSL before a more meaningful bullish reaction develops.
Key Levels:
• Fair Value Gap (Sell Zone): 65,000–66,000
• Current Structure: Corrective recovery within a bearish trend
• Primary Downside Objective: Sell-Side Liquidity (SSL) at 59,000
• Bias: Bearish below the FVG, looking for sell opportunities on rejection.  Short
Short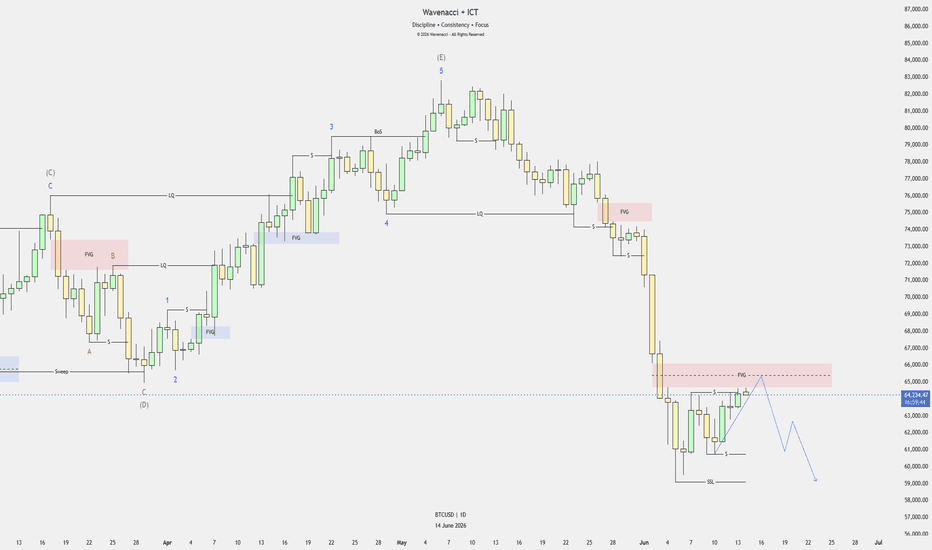
XAUUSD – H1 Bearish Structure Remains Active Below Sell Zone
Gold is still trading under short-term bearish pressure on the H1 chart. After the sharp decline from the upper liquidity area, price is now moving inside a corrective structure, but the recovery remains limited below the key sell zone around 4,247 – 4,254.
FUNDAMENTAL ANALYSIS
Gold is still reacting to the U.S. dollar, Treasury yields and upcoming U.S. data. For now, the technical structure remains more important because price has not confirmed a strong bullish reversal yet.
As long as gold stays below the main resistance and sell zone, the short-term view remains cautious and sellers may continue to defend higher prices.
TECHNICAL ANALYSIS – SMC + FIBONACCI
From an SMC perspective, gold has already created a strong bearish displacement on H1. The market broke below previous support, then formed a recovery from the lowest support this week around 4,022.
However, the current rebound is still trading below the major liquidity zone and below the SMA 200. This means the upside move may only be a corrective pullback before sellers react again.
The sell entry zone around 4,247 – 4,254 is the key area to watch. This zone sits near the previous breakdown area and may act as a resistance test. If price reaches this area and shows rejection, the bearish continuation setup becomes more attractive.
The lower liquidity area around 4,175 – 4,185 is also important. If gold breaks below this zone, sellers may push price toward the buy-test resistance around 4,119, then possibly back to the weekly low at 4,022.
KEY PRICE ZONES TO WATCH
Current price area: 4,218
Liquidity support zone: 4,175 – 4,185
Buy-test resistance: 4,119
Sell entry zone: 4,247 – 4,254
Major resistance: 4,269
Upper liquidity zone: 4,375 – 4,400
Lowest support this week: 4,022
Main bearish target: 4,119 – 4,022
Invalidation area for sell view: Above 4,269
TRADING SCENARIOS
Sell Scenario – Priority H1 View
If gold recovers into the 4,247 – 4,254 sell zone and shows rejection, I will watch for a bearish continuation setup.
Sell Zone: 4,247 – 4,254
Entry Condition: Bearish rejection, failed breakout, lower-timeframe CHoCH, or strong bearish displacement from the sell zone.
Stop Loss: Above 4,269 or above the nearest swing high.
Take Profit:
TP1: 4,175 – 4,185
TP2: 4,119
TP3: 4,022
Alternative Sell Scenario
If gold breaks below the 4,175 – 4,185 liquidity zone with strong momentum, sellers may return earlier without waiting for a higher pullback.
Sell Condition: Wait for a clean break below the liquidity zone, then watch for a retest and rejection.
Target: 4,119 – 4,022
Buy Scenario – Only Short-Term Reaction
A buy setup is not the main view on H1. However, if gold sweeps the 4,175 – 4,185 liquidity zone and quickly recovers, a short-term corrective bounce may appear.
Buy Zone: 4,175 – 4,185
Entry Condition: Liquidity sweep, bullish rejection, or lower-timeframe bullish CHoCH.
Take Profit:
TP1: 4,218
TP2: 4,247 – 4,254
Invalidation: If price breaks and holds below 4,175, the buy idea is invalid.
MY VIEW ON GOLD
My H1 view for gold remains bearish while price stays below the 4,247 – 4,254 sell zone and below the stronger resistance around 4,269.
The cleaner plan is to wait for price to retest the sell zone, then observe rejection on the smaller timeframe. If sellers defend this area, gold may continue lower toward 4,175, 4,119 and possibly 4,022.
Overall, gold can still recover slightly in the short term, but the main H1 structure remains weak unless buyers reclaim 4,269 with strong momentum.
Do you think gold will reject from the 4,247 – 4,254 sell zone, or break lower from the liquidity area first?
Short 
BTCUSD 5M AnalysisBTC is trading around 64,147, holding above the 0.5 Fibonacci level (64,028) and 0.618 level (63,985). Price recently made a strong bullish impulse and is now consolidating near intraday highs.
Key Levels
Resistance: 64,210 → 64,500
Support: 64,028 → 63,985
Major Support: 63,846
Market View
The structure remains bullish while price stays above the 64,000 area. The current pullback looks corrective rather than a confirmed reversal. Buyers may look for continuation if BTC reclaims and holds above 64,210. Long 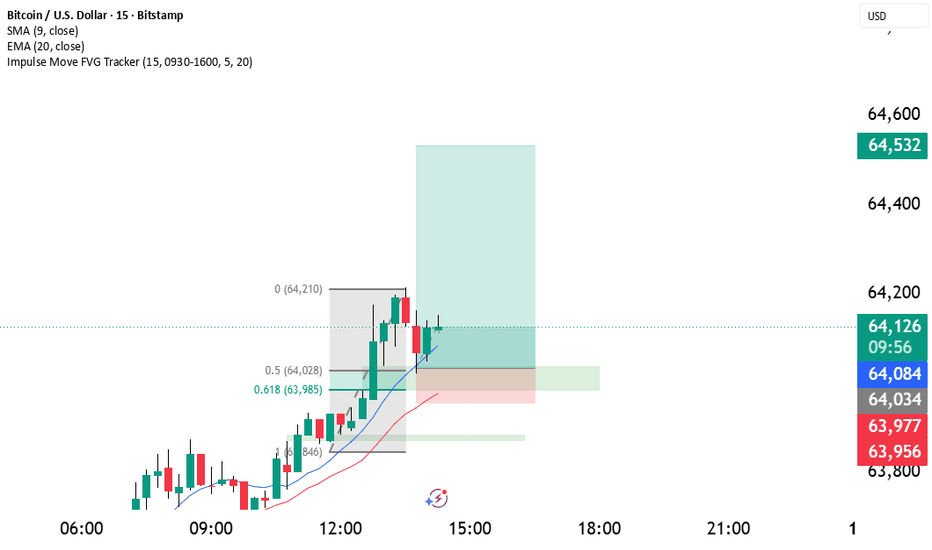
XAUUSD — EMA Bearish Trend, Sell From Fibonacci Value Zone
Fundamental Analysis
Gold remains under bearish pressure as the market focuses on key USD events this week, including the Federal Funds Rate, FOMC Economic Projections, FOMC Statement, and the FOMC Press Conference.
These events may create strong volatility for XAUUSD. If the Fed tone supports USD strength or keeps rate expectations tight, gold may continue to face selling pressure on recovery attempts.
Technical Analysis
On the 4H chart, XAUUSD is still moving inside a descending channel. EMA 34, EMA 89, and EMA 200 remain above price, confirming that the main trend is still bearish.
Price is currently trading around 4,218 after a short-term recovery from the lower area. However, this bounce is moving toward the Fibonacci value zone and EMA resistance area around 4,240 - 4,280.
This zone is important because it aligns with the 0.236 - 0.382 Fibonacci retracement, the EMA range, previous broken structure, and channel pressure. If price rejects from this area, sellers may regain control.
The key bearish confirmation level is 4,170. A clean break below this level would strengthen the downside continuation toward 4,026. If bearish momentum expands further, the weekly goal remains the Fibonacci Extension 1.618 zone around 3,813 - 3,815.
Important Key Levels
Current price area: 4,218
Fibonacci value sell zone: 4,240 - 4,280
EMA sell range: 4,240 - 4,280
Short-term resistance: 4,239 - 4,281
Key bearish confirmation level: 4,170
Reaction support: 4,026
Weekly Fibonacci Extension target: 3,813 - 3,815
Invalidation area: above 4,370
Trading Scenario
Main Sell Scenario
Entry: 4,240 - 4,280
Stop Loss: 4,370
Take Profit 1: 4,170
Take Profit 2: 4,026
Take Profit 3: 3,813 - 3,815
Sell Condition
The preferred setup is to wait for gold to pull back into the 4,240 - 4,280 Fibonacci value zone. This area aligns with the EMA sell range, descending channel pressure, and previous broken structure.
A sell setup becomes more valid if price forms bearish rejection from this zone, such as a long upper wick, bearish engulfing candle, failed breakout, or lower high below the EMA structure.
If price rejects from the sell zone and breaks below 4,170, the bearish continuation view becomes stronger. The next reaction level is 4,026, followed by the weekly Fibonacci Extension target around 3,813 - 3,815.
Entry Conditions
Wait for price to retest 4,240 - 4,280.
Look for bearish rejection before entering sell.
A break below 4,170 confirms stronger bearish pressure.
Be careful with FOMC volatility this week.
If price breaks and holds above 4,370, the sell setup is invalid.
Overall, the main view remains bearish while XAUUSD trades below the EMA structure and inside the descending channel. The preferred plan is to wait for a pullback into the Fibonacci value zone, then look for sell confirmation toward 4,170, 4,026, and the weekly Fibonacci Extension zone around 3,813 - 3,815.
Do you share the same bearish view on gold, or are you waiting for FOMC confirmation before taking a position?
Short 
Long 
Gold May Recover Into Fibonacci 0.5 Before Sellers React AgainXAUUSD – Gold May Recover Into Fibonacci 0.5 Before Sellers React Again
Gold is showing a short-term recovery after sweeping the weekly low area around 4,024. However, the broader H4 structure is still trading under the descending trendline and below the SMA 200, which means the current upside move should be treated as a corrective pullback unless price can break the higher resistance zone clearly.
FUNDAMENTAL ANALYSIS
Gold is still reacting strongly to the U.S. dollar, Treasury yields and upcoming U.S. data. The current rebound looks more like a technical recovery after sweeping lower liquidity, while the broader market has not confirmed a full bullish shift yet.
For now, I prefer using fundamentals as background only and focusing more on price reaction around the key Fibonacci, FVG and trendline zones.
TECHNICAL ANALYSIS – SMC + FIBONACCI
From an SMC perspective, gold has swept the lower liquidity near the weekly low around 4,024 and created a strong rebound. This reaction shows that buyers are active in the lower zone, but price is now approaching a more important decision area above.
The current buy zone around 4,160 – 4,182 is holding as short-term support. As long as price stays above this zone, gold may continue its corrective move toward the FVG and Fibonacci 0.5 area around 4,280 – 4,312.
This upper area is very important because it combines several technical factors: Fibonacci 0.5 retracement, FVG, previous liquidity, and the descending trendline. If price reaches this zone and starts to reject, it may become the main sell reaction area.
The bigger trend is still bearish while gold remains below the trendline and below the 4,363 buyside liquidity. A clean break above the sell zone would weaken the bearish view, but if sellers defend the Fibonacci area, gold may continue lower again toward 4,182, 4,116 and possibly back to the weekly low.
KEY PRICE ZONES TO WATCH
Current price area: 4,194
Short-term support / Buy zone: 4,160 – 4,182
Breakout level: 4,116
Fibonacci 0.5 / FVG sell zone: 4,280 – 4,312
Trendline reaction area: 4,280 – 4,312
Major buyside liquidity: 4,363
Nearest downside target: 4,182
Secondary downside target: 4,116
Weekly low: 4,024
Invalidation area for sell view: Above 4,312 – 4,363
TRADING SCENARIOS
Buy Scenario – Short-Term Recovery View
If gold holds above the 4,160 – 4,182 buy zone, I will watch for a short-term recovery toward the Fibonacci 0.5 area.
Buy Zone: 4,160 – 4,182
Entry Condition: Bullish rejection, liquidity sweep, or lower-timeframe CHoCH.
Stop Loss: Below 4,160 or below the nearest swing low.
Take Profit:
TP1: 4,240
TP2: 4,280
TP3: 4,312
Sell Scenario – Priority Reaction View
If gold reaches 4,280 – 4,312 and shows rejection, I will watch for a sell reaction from the Fibonacci 0.5, FVG and trendline confluence.
Sell Zone: 4,280 – 4,312
Entry Condition: Bearish rejection, failed breakout, or lower-timeframe CHoCH.
Stop Loss: Above 4,312 or above the nearest swing high.
Take Profit:
TP1: 4,182
TP2: 4,116
TP3: 4,024
Alternative Scenario
If gold breaks below 4,160 – 4,182 with strong momentum, the recovery idea becomes weaker and sellers may return earlier.
Sell Condition: Wait for a clean break and retest below the buy zone.
Target: 4,116 – 4,024
MY VIEW ON GOLD
My current view is that gold may continue its short-term recovery first, with the main upside area sitting around 4,280 – 4,312. This is the zone where I will watch sellers carefully because it combines Fibonacci 0.5, FVG and the descending trendline.
The cleaner plan is not to chase price in the middle. I prefer watching two reactions on the smaller timeframe: first, whether buyers can hold 4,160 – 4,182 for a move higher; second, whether sellers appear strongly around 4,280 – 4,312.
Overall, gold can still recover in the short term, but the main structure remains bearish unless price breaks above the trendline and holds above the sell zone.
Do you think gold will reach the 4,280 – 4,312 Fibonacci zone before sellers react again?
Long 
GOLD - Countertrend correction to the liquidity zoneFollowing the false breakout below the 4030 support level, ICMARKETS:XAUUSD is rebounding higher, with recent shifts in the geopolitical backdrop adding fuel to the move. However, the market remains bearish overall.
Optimism sparked by Trump's decision to cancel major strikes against Iran and renewed hopes for a deal has been replaced by fresh clashes in the Strait of Hormuz. Geopolitical instability remains elevated. Against this backdrop, the U.S. Dollar Index continues to hold firm, putting pressure on gold. Hotter-than-expected U.S. inflation data has reinforced expectations of a 0.25% Fed rate hike in December. Sellers are therefore likely to remain in control.
Key catalysts ahead include consumer sentiment and inflation expectations data on Friday, as well as the first Federal Reserve meeting under the new Chair, Kevin Warsh, next week. Geopolitics will continue to play a decisive role
Resistance levels: 4246 – 4315 – 4368
Support levels: 4171, 4100, 4060
The market is reacting to the false breakdown of support, resulting in a countertrend correction. Gold is moving toward a key liquidity zone, with the main area of interest located between 4315 and 4368.
A short squeeze within this zone would confirm a liquidity-driven manipulation and could trigger a reversal, leading to a move lower toward the next key areas of interest.
Best regards,
R. Linda Short 
 Long
Long
XAUUSD Buy Scenario: Liquidity Sweep CompletedXAUUSD has shown signs of completing its bearish five-wave decline after sweeping liquidity below the recent lows and producing a strong bullish reaction. The sharp rejection from the low suggests that sellers may be losing momentum, while buyers begin to step into the market.
From an Elliott Wave perspective, the recent low is a potential Wave 5 completion point, increasing the probability of a corrective recovery. The current bullish displacement indicates that the market may be transitioning from a bearish impulse into a retracement phase.
The preferred buy scenario is to wait for a pullback into the 4,088-4,111 buy zone, where liquidity and market structure align. A retracement into this area would allow the market to rebalance before potentially continuing higher. As long as buyers defend this zone, the recent liquidity sweep is likely to remain the short-term low.
While the higher timeframe favors a corrective recovery, traders on lower timeframes may still find short-term sell opportunities. Any rally into nearby liquidity pools, premium areas, or intraday resistance levels could attract temporary selling pressure before the broader retracement resumes. These sell setups should be viewed as short-term countertrend trades within a larger corrective bullish phase.
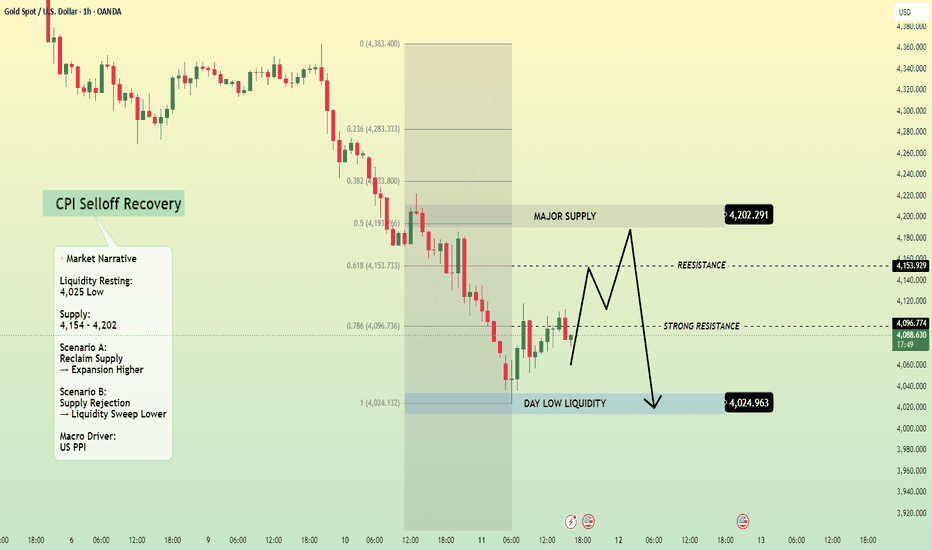
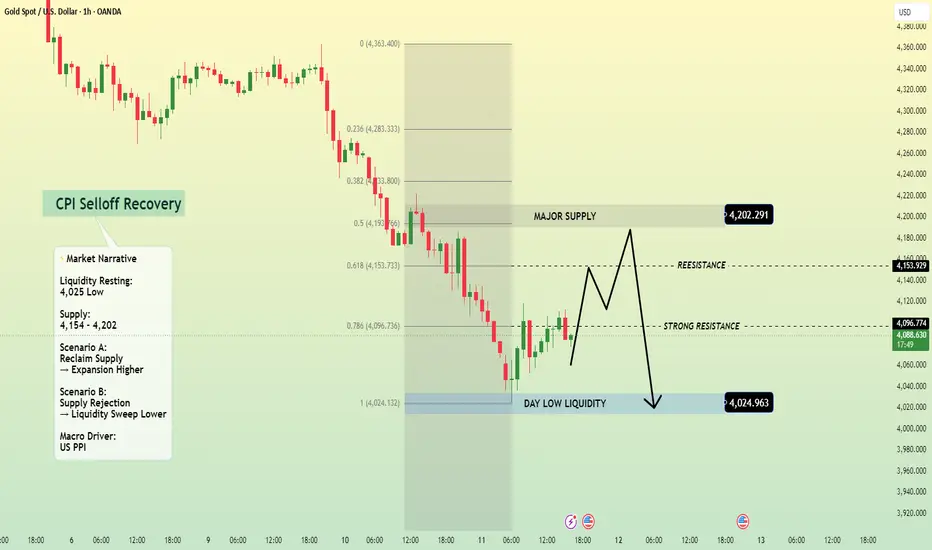
Overall, the main focus remains on the 4,088-4,111 buy zone. If buyers continue to defend this area, the recent liquidity sweep could mark the completion of Wave 5 and support a broader move toward higher liquidity targets, while lower timeframes may offer tactical sell opportunities during corrective rallies. PPI Night Ahead – Relief Rally Or Just A Dead Cat Bounce?Gold is attempting a recovery after yesterday’s CPI-driven selloff, but the broader H1 structure remains bearish.
The market is now shifting focus to tonight’s high-impact U.S. data:
📊 PPI m/m Forecast: 0.7% (Previous 1.4%)
📊 Core PPI Forecast: 0.5%
📊 Initial Jobless Claims Forecast: ~220K (Previous 225K)
A softer PPI or weaker labor data would reinforce expectations for future Fed easing, potentially weakening the USD and supporting Gold. On the other hand, stronger-than-expected inflation or labor figures could revive USD strength and pressure bullion once again.
From a technical perspective, Gold is rebounding from the 1.0 Fibonacci extension near 4,024 after an aggressive markdown phase. Buyers have managed to defend the daily low zone, creating a short-term relief bounce.
Key H1 Levels
🔹 Resistance: 4,153.929
🔹 Major Supply Zone: 4,202.291
🔹 Current Pivot: 4,096.774
🔹 Day Low Support: 4,024.963
IF–THEN Scenario
✅ If price reclaims and closes above 4,153.929, buyers may extend the recovery toward the 4,202.291 supply zone.
❌ If price fails below resistance and sellers regain control, the market could revisit 4,024.963, with risk of a fresh liquidity sweep lower.
With PPI and Jobless Claims both scheduled during the U.S. session, volatility is expected to increase sharply. Waiting for post-news confirmation may provide cleaner institutional setups than predicting the release itself. Short