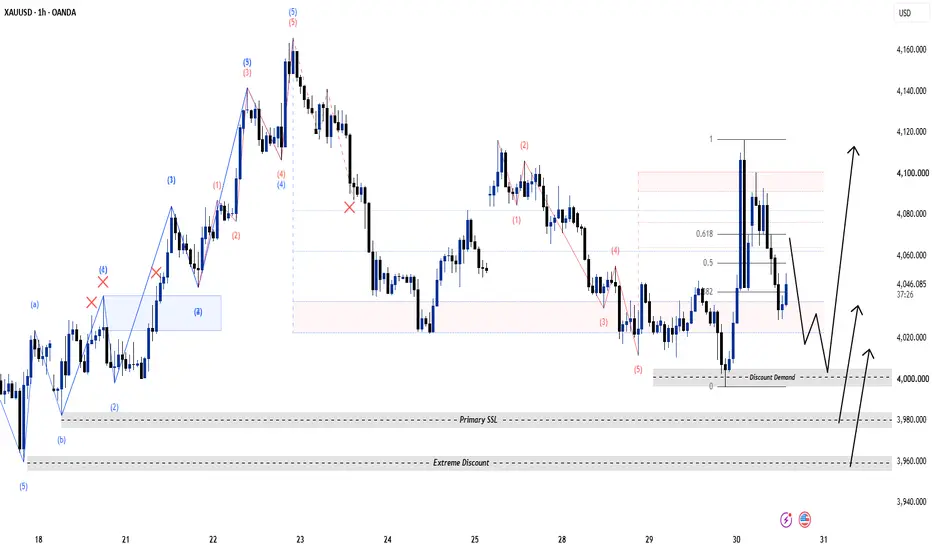
Gold H1: Is $4,000 the Next Liquidity Sweep?Gold is trading around $4,047, after the FOMC kept rates unchanged. The market is now shifting attention toward US Q2 GDP and June PCE, keeping volatility elevated. Gold initially reacted positively to the Fed decision, while the dollar eased, but the inflation data could still reshape rate expectations.
H1 Structure
The chart shows a clear bullish recovery from the $3,960–$3,980 discount area.
H1 impulsive leg remains constructive.
Price is currently retracing from the $4,100–$4,115 premium area.
Fibonacci retracement places the key reaction zones around:
0.382: ~$4,020
0.5: ~$4,040
0.618: ~$4,060
The $4,000 psychological level remains the major liquidity/demand zone.
Deeper demand sits around $3,960–$3,980.
Key Zones
Resistance / BSL
$4,075–$4,100
$4,115–$4,120
Retracement / Reaction
$4,040–$4,050
$4,020–$4,030
Major Demand
$4,000–$4,005
$3,960–$3,980
🧠 IF–THEN Playbook
IF Gold holds $4,020–$4,040 and prints bullish CHoCH/MSS on M15 →
THEN look for continuation toward $4,075 → $4,100 → $4,115.
IF price sweeps $4,000–$4,005 and quickly reclaims the level →
THEN the deeper liquidity grab could become the higher-quality long setup.
IF H1 closes decisively below $3,960 →
THEN the bullish recovery structure is invalidated.
Are we seeing a healthy H1 retracement — or the start of another $4,000 liquidity sweep?  Long
Long
Mazagon Dock: Potential Reversal Candidate with Multi-Timeframe Mazagon Dock: Potential Reversal Candidate with Multi-Timeframe Bullish Setup
Mazagon Dock Shipbuilders Ltd. – Technical View
CMP: ₹2,523
Stop Loss: ₹2,310
Targets: ₹2,810 | ₹3,061 | 3326
Mazagon Dock is emerging as a potential reversal candidate, supported by bullish formations across multiple timeframes.
On the daily chart, the stock is forming a Flag & Pole continuation pattern. A decisive breakout above ₹2,569 could confirm the pattern and trigger fresh upside momentum.
On the weekly chart, the stock appears to be forming a Rounding Bottom pattern. A sustained breakout above ₹2,810 would confirm the larger reversal structure and may pave the way for the next leg of the uptrend toward ₹3,061.
Risk Management
Maintain strict stop-loss discipline.
Control position sizing.
Avoid overexposure in a volatile market.
Pyramiding can be considered only after a sustained move above key resistance levels with confirmation of trend continuation.
Consider partial profit booking near Target 1 and trail the stop loss thereafter.
⚠️ Be cautious in volatile markets. Maintain strict stop-loss discipline, control position sizing, avoid aggressive pyramiding, and do not overexpose capital.
⚠️ Clarification:
This is an independent analysis based purely on technical and market study. No part of Religare is involved in this view or recommendation.
📝 Important:
I am not responsible for any loss or profit incurred. I am not taking any fees for these views—just sharing my analysis for educational and informational purposes.
📉 Disclaimer:
Not SEBI-registered. Please do your own research or consult a financial advisor before taking any investment decision.  Long
Long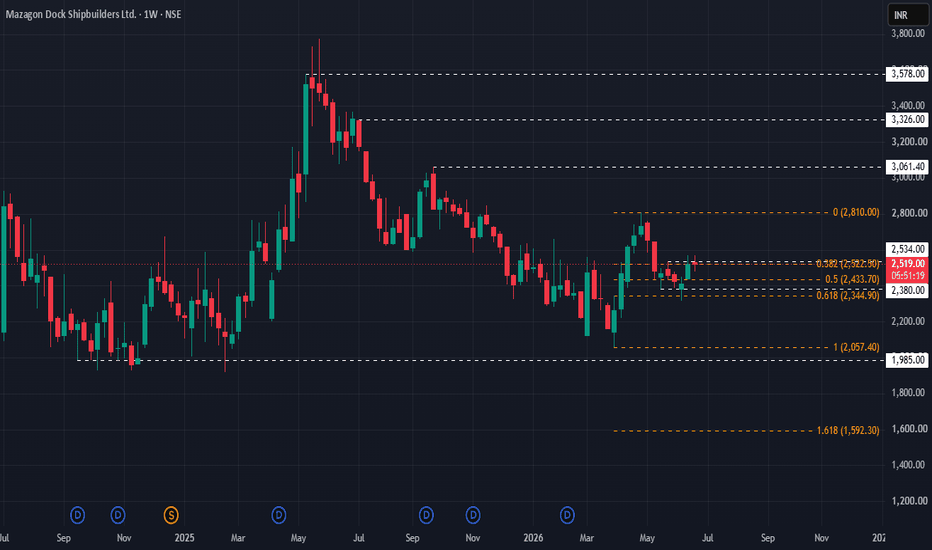
 Long
Long
EURUSD | Buy-Side Liquidity Sweep Signals Bearish ContinuationEURUSD continues to present a bearish technical outlook following a buy-side liquidity sweep above the 1.14750 resistance level and the 2 July high, where price failed to sustain bullish momentum before rejecting lower. This liquidity grab suggests that buying pressure may have been exhausted, shifting the focus towards a potential continuation of the prevailing bearish structure. I will be monitoring a retracement into the highlighted retest zone, where multiple technical factors converge, including the 61.8%–88.6% Fibonacci retracement, previous market structure, and the potential alignment of the 200-period EMA as dynamic resistance. Should sellers defend this area, downside objectives remain the 13 July swing low, the current monthly low, and ultimately the previous month's support. However, a sustained 4-hour close above the liquidity sweep high would invalidate the current bearish thesis and suggest buyers have regained control.
From a fundamental perspective, this outlook is supported by the potential for continued US dollar strength should the Federal Reserve maintain a relatively restrictive monetary policy stance compared with the European Central Bank. A widening interest rate differential in favour of the United States, supported by elevated Treasury yields and resilient US economic data, could continue to underpin demand for the dollar, while softer Eurozone growth or inflation may reinforce expectations of a more accommodative ECB. Market participants should also remain attentive to upcoming high-impact releases, including US CPI, Non-Farm Payrolls, FOMC communications, and Eurozone inflation and ECB policy decisions, as these events may either reinforce or challenge the current macro narrative. While price action will ultimately determine whether this scenario develops, the technical and fundamental backdrop currently remain aligned in favour of further downside unless the stated invalidation level is reclaimed. ETHUSD: Golden OTE Zone (0.72–0.78) + MSS | Long to 1975 BSLExecutive Summary & Signal Overview
📍 Asset: ETH/USD (Ethereum / US Dollar)
🐂 Position Type: Limit Buy / Long Entry
🏁 Buy Zone: 1,875.00 – 1,880.00
🛡️ Stop Loss (SL): 1,856.83 (Below Fibonacci Level 1 / Swing Low)
🎯 Target 1 (BSL 1): 1,925.00 (Fib Anchor Peak)
🎯 Target 2 (BSL 2): 1,952.00 (Intermediate High)
🎯 Target 3 (BSL 3): 1,975.00 (Major Range High)
⚖️ Risk-to-Reward (R:R): 1 : 4.4+
🔍 2. Technical & Confluence Breakdown
📐 A. Fibonacci Golden Ratio / OTE Zone (0.72 – 0.78)
Drawing the Fibonacci retracement from the recent expansion low (1,857) to the local swing high (1,925), the $1,875 – $1,880 area lines up precisely with the 0.72 – 0.78 Optimal Trade Entry (OTE) golden zone.
This level acts as a high-probability discount area where institutional buyers re-enter long positions before continuing impulse moves.
🔄 B. Lower Timeframe Market Structure Shift (MSS)
Prior to the current push, price swept the lower Sell-Side Liquidity (SSL) and responded with strong bullish displacement, creating a clean Market Structure Shift (MSS) to the upside.
The structural shift confirms that short-term seller momentum has exhausted and buyers are in control of order flow.
📦 C. Demand Zone Confluence
The $1,875 – $1,880 region overlaps with an unmitigated 15m order block / demand zone responsible for breaking the local structure. Retesting this block provides a strong risk-defined entry.
🧲 D. Unfilled Buy-Side Liquidity (BSL) Targets
Multiple clean swing highs sit stacked at 1,925.00, 1,952.00, and ultimate liquidity resting at 1,975.08. These pools represent prime exit liquidity for the move.
🛡️ 3. Execution & Risk Management Guidelines
Invalidation Level:
A candle close below $1,856.83 invalidates the OTE setup, signaling that the move was a temporary pullback rather than a structural reversal.
Partial Profit Protocol:
At TP 1 ($1,925.00): Lock in 30–40% partials and secure the trade by moving Stop Loss to Breakeven (BE).
At TP 2 ($1,952.00): Take another 30% off the table and trail stops under lower-timeframe higher lows.
At TP 3 ($1,975.00): Full exit or leave a minimal runner for higher timeframe imbalances.
⚠️ Educational Disclaimer: This signal analysis is strictly for educational, analytical, and back testing purposes only. It is not financial advice. Always adhere to strict risk management and never risk more capital than you are prepared to lose! 🛡️✨  Long
Long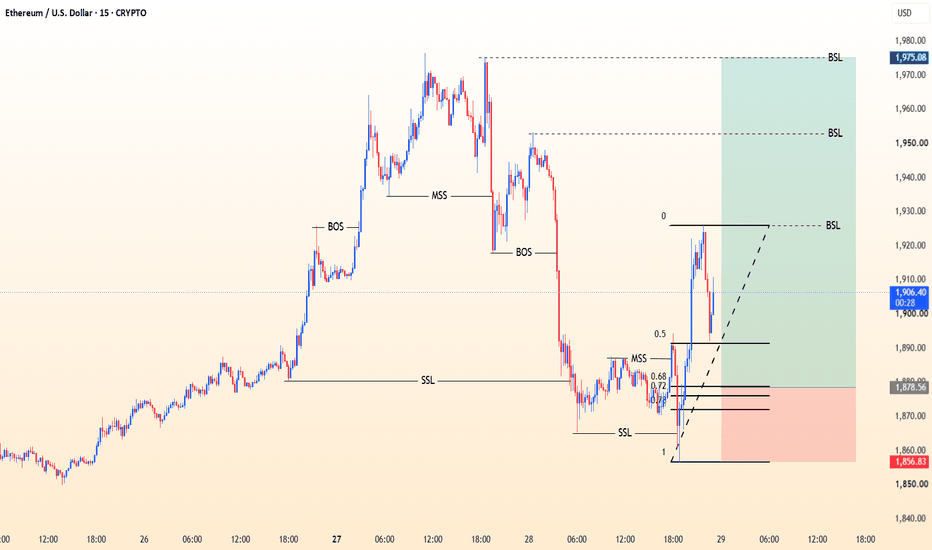
Filing & Packing Material (2180) : Bull Run or Cool Off for now?TADAWUL:2180
📈 Weekly Trend Reversal Confirmed — Is This the Beginning of a Bigger Bull Run? 🇸🇦
After an extended period of consolidation, the weekly chart has officially shifted into a bullish market structure, with price now printing a series of Higher Highs (HHs) and Higher Lows (HLs)—one of the strongest technical signals that a trend reversal may already be underway.
The focus now shifts from identifying the bottom to managing the next phase of the uptrend.
🔍 Technical Outlook
The recent HH-HL formation confirms that buyers have regained control, increasing the probability of sustained upside momentum.
Adding further confidence to the bullish case, the Relative Strength Index (RSI) remains in bullish territory, indicating healthy buying pressure and positive momentum.
📌 Daily 200 EMA: The Trend Defender
One of the most important technical levels to monitor is the Daily 200 EMA, currently positioned around 31.
A successful retest and sustained trading above this level would reinforce the long-term bullish structure, turning it into a key dynamic support for future pullbacks.
🎯 Short-Term & Long-Term Targets
🚀 Short-Term Resistance
📍 36.50 remains the immediate resistance zone.
A decisive breakout above this level could trigger fresh momentum and attract additional buyers.
📈 Medium-to-Long-Term Target
If the current HH-HL structure remains intact and the trend continues to strengthen, the next major technical objective is:
🎯 46.00
This remains the preferred upside target as long as the market structure is not invalidated by lower highs or lower lows.
📊 My View
The chart is becoming increasingly constructive.
✅ Weekly Higher High–Higher Low structure confirms the reversal.
✅ RSI remains in bullish territory, supporting continued momentum.
✅ Daily 200 EMA (31) is expected to act as a key support zone on future pullbacks.
✅ A breakout above 36.50 could accelerate the rally toward the 46 medium-term target.
Rather than chasing every green candle, I'd prefer to use healthy pullbacks into support as potential opportunities, while respecting the bullish market structure.
Do you think this trend reversal has enough momentum to reach 46, or will 36.5 prove to be a major hurdle? Share your technical view below! 👇
⚠️ Financial Disclaimer
Disclaimer: This analysis is shared for educational and informational purposes only and should not be considered financial, investment, or trading advice. Always conduct your own research (DYOR) and apply proper risk management before making any investment decisions.
#Tadawul #SaudiStockMarket #SaudiStocks #TASI #SaudiInvesting #SaudiTrading #SaudiInvestors #KSAStocks #SaudiEquities #MiddleEastMarkets #GCCMarkets
#TechnicalAnalysis #TradingView #PriceAction #MarketStructure #HigherHigh #HigherLow #TrendReversal #BullishTrend #EMA200 #RSI #SwingTrading #TrendFollowing #Breakout #MomentumTrading #SupportAndResistance #ChartAnalysis #TradingIdeas #StockAnalysis #Investing #RiskManagement #WiSHFundManagement
 Long
Long
Short 
 Short
Short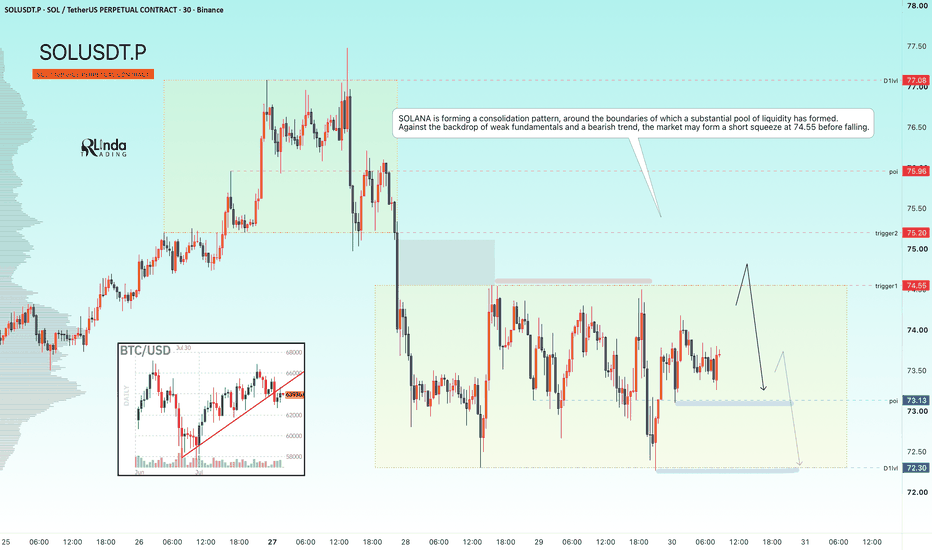
GOLD - Ahead of the Fed meeting. Bearish trendICMARKETS:XAUUSD is rebounding from the 4000 level but remains trapped within the 4010–4050 trading range. At the same time, the U.S. Dollar Index has entered a consolidation phase as markets await the upcoming Federal Reserve meeting
Gold is trading cautiously ahead of the Fed decision amid renewed geopolitical tensions. The key catalyst will be the Fed's guidance on the future path of interest rates. Any hint of a dovish shift could fuel a rally in gold, while a hawkish message would likely restore downside pressure.
Bullish drivers: Dovish Fed rhetoric, A weaker U.S. dollar, Lower rate expectations, Geopolitical de-escalation
Bearish drivers: Hawkish Fed guidance (persistent inflation concerns, hints of further tightening, a more hawkish voting balance), Escalation of geopolitical tensions, supporting both the U.S. dollar and oil prices
Resistance levels: 4070, 4083, 4116
Support levels: 4011, 3983
Fundamentally, there are reasons to expect the Federal Reserve to maintain a hawkish tone. From a technical perspective, gold remains under pressure within a broader bearish trend. As a result, the upcoming news-driven volatility could trigger a retest of the 4070–4083 resistance zone—or even 4116—before the downtrend resumes toward the 4000–3950 area.
Best regards,
R. Linda Short 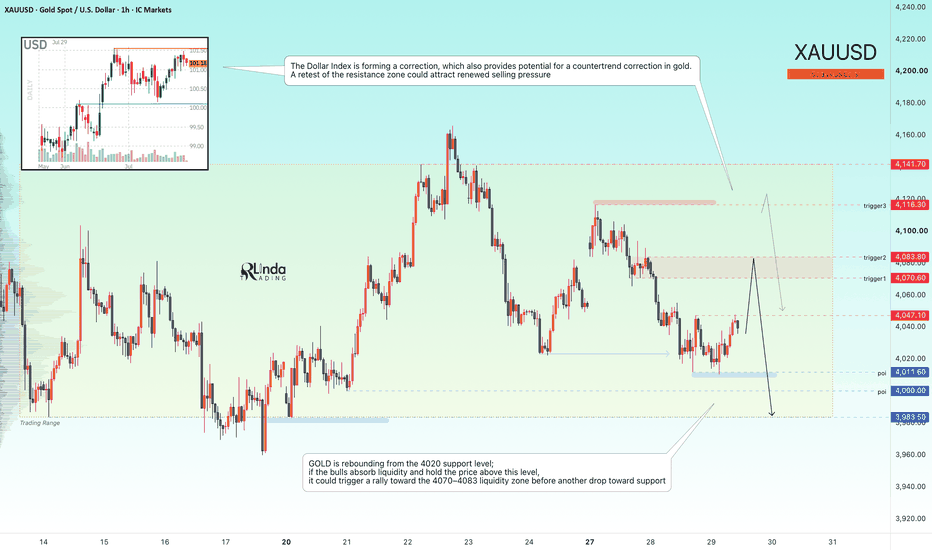
Long 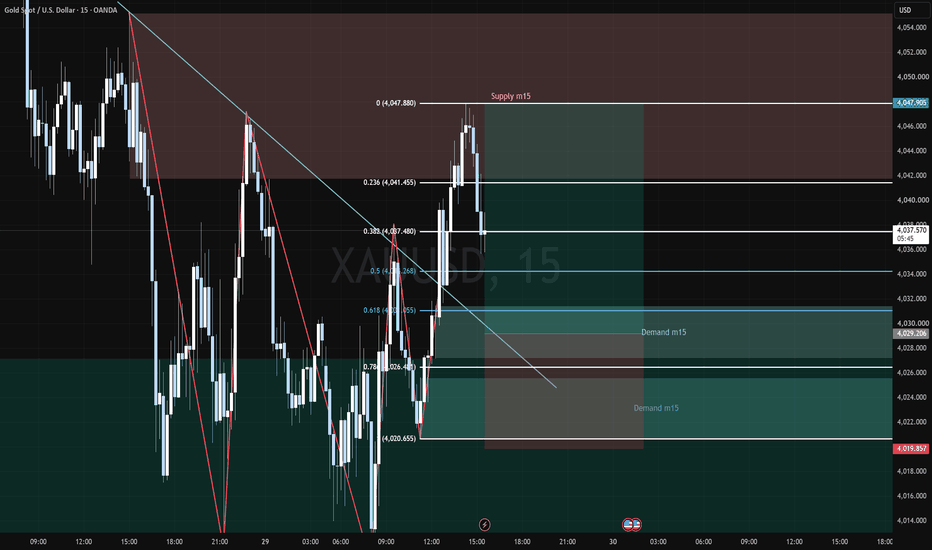
XAU/USD FOMC Trade Plan: Fibonacci Discount Buy Zone AnalysisTrade Plan: XAU/USD Buy Setup
Bias: Bullish (Smart Money Concepts / ICT)Entry Zone: 4,025.00 – 4,030.00 (0.618–0.786 Fibonacci OTE Discount)
Stop Loss: 4,010.76 (Below recent structural swing low)
Take Profit Targets: TP 1: 4,090.00 (Internal BSL)
TP 2: 4,100.00 (Psychological level / BSL)
TP 3: 4,116.24 (Main BSL target)
⚡ Technical Logic Liquidity Sweep: Price took out external liquidity around 4,020.00.Structure: Market Structure Shift (MSS) followed by a Break of Structure (BOS) confirms short-term upside expansion.
Value Entry: Deep retracement into discount Fibonacci levels offers an asymmetric Risk-to-Reward ratio.
⚠️ FOMC Execution Protocol High-Impact News Warning: FOMC rate announcements generate extreme volatility, spread widening, and sharp liquidity sweeps.
Option A (Lower Risk): Cancel limit orders before news release. Allow the initial news spike to sweep liquidity, then look for a 5m/1m confirmation entry once the direction stabilizes.
Option B (Direct Entry): If holding through news, cut position sizing in half ($0.5\times$ normal lot size) to account for potential slippage.
⚠️ Educational Content Only — Not Financial Advice ⚠️
Disclaimer: 📚 This chart analysis and trade plan are shared strictly for educational and informational purposes only 🎓. Trading Forex, Gold (XAU/USD), and leveraged instruments involves substantial risk of loss 📉 and is not suitable for every investor. Past performance and technical setups do not guarantee future results 🔮. Always do your own research (DYOR) 🔍, manage your risk responsibly 🛡️, and consult a certified financial advisor before making any investment decisions 💼. Long 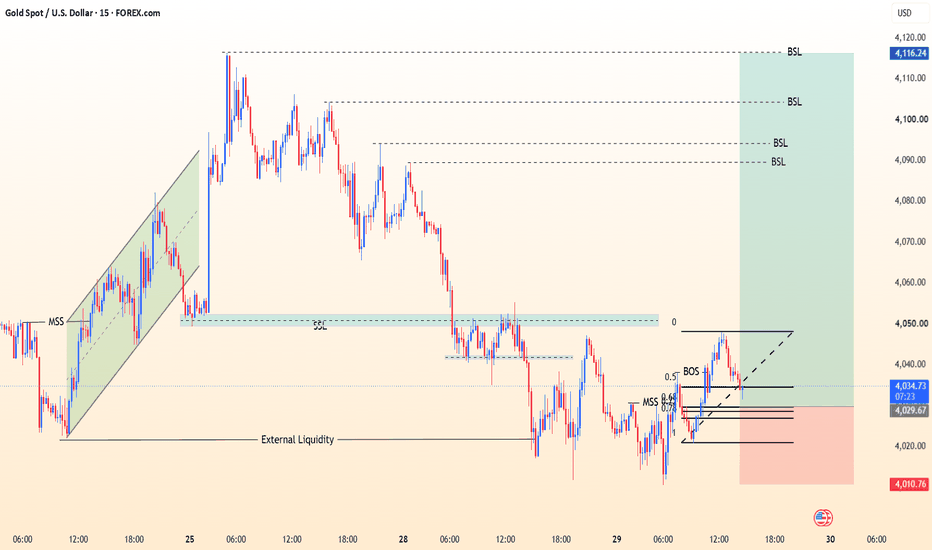
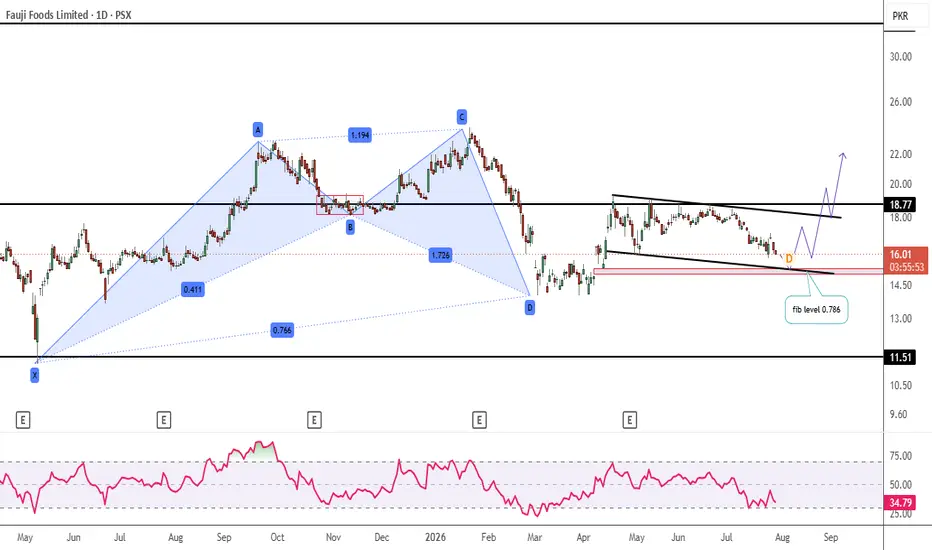
FFL 🇵🇰: High-Probability Reversal Setup ?PSX:FFL
📉 Discount Zone Approaching: Is This the Next High-Probability Reversal Setup? 🇵🇰📈
The stock is gradually moving toward the 0.786 Fibonacci retracement level—a zone that has historically acted as a high-conviction demand area.
From a price action perspective, this is a level worth watching closely rather than chasing the current move.
🔍 Why the 0.786 Fibonacci Level Matters
Looking at the stock's previous major correction, price respected the 0.786 Fibonacci retracement almost perfectly.
Following that reaction:
✅ Price consolidated for nearly a month.
✅ Buyers gradually regained control.
✅ The stock delivered an impressive ~30% rally in a relatively short period.
While history doesn't guarantee repetition, it highlights the importance of this technical zone.
🎯 Potential Reversal Zone
The next key demand area lies around:
📍 15.20–15.00
If price enters this region and begins to show bullish price action, increasing volume, or a confirmed reversal pattern, it could offer an attractive risk-to-reward opportunity.
🚀 Potential Upside Targets
A successful rebound from the demand zone could initially target:
🎯 17.50 – First resistance and short-term objective.
🎯 18.00 – Previous supply zone.
🎯 18.80 – Major technical resistance.
📈 Bullish Confirmation
The most important breakout level remains:
📌 19.00
A sustained close above 19.00, supported by strong volume and continued buying momentum, would strengthen the bullish outlook and could pave the way for an extended rally toward 21–22.
📊 My View
The stock is approaching one of the most interesting technical zones on the chart.
Rather than anticipating a reversal, I prefer to wait for confirmation through bullish candlestick patterns, improving momentum, or a Higher Low before considering fresh positions.
If the 15.20–15.00 demand zone holds, it could become a compelling accumulation area for swing traders.
Do you think the 0.786 Fibonacci level will once again attract buyers, or will the market need a deeper correction before the next rally? Share your analysis below! 👇
⚠️ Financial Disclaimer
Disclaimer: This analysis is shared for educational and informational purposes only and should not be considered financial or investment advice. Always conduct your own research and apply appropriate risk management before making investment decisions.
#PSX #PakistanStockExchange #PakistanStocks #KSE100 #PSXTrading #PakistanInvesting #PakistanEquities #PSXInvestors #KarachiStockExchange #ValueInvesting
#TechnicalAnalysis #TradingView #PriceAction #MarketStructure #Fibonacci #FibonacciRetracement #DemandZone #SupportAndResistance #SwingTrading #Breakout #BullishReversal #ChartPatterns #TrendFollowing #MomentumTrading #TradingIdeas #ChartAnalysis #StockAnalysis #RiskManagement #Investing #StockMarket #WiSHFundManagement  Long
Long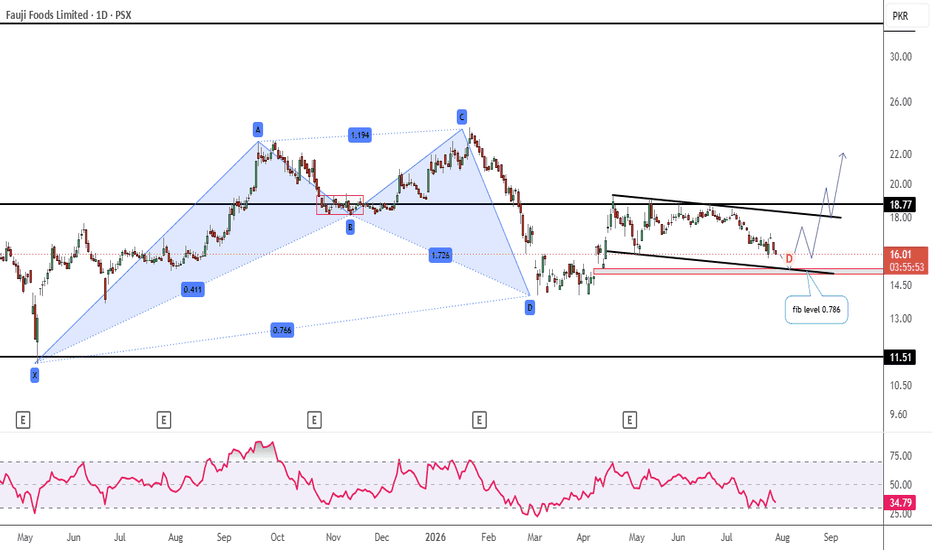
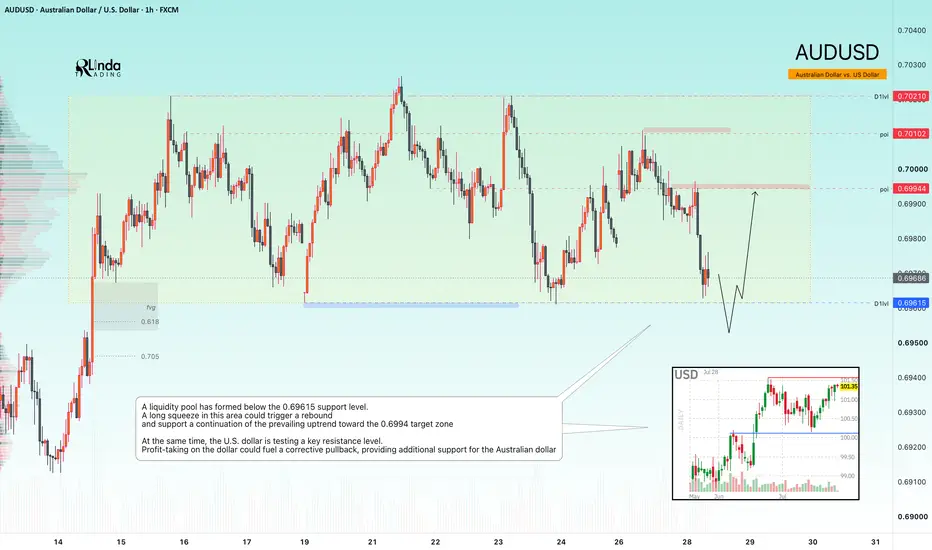
AUDUSD - A long squeeze could trigger a rally FX:AUDUSD is testing a key support zone, with a significant liquidity pool positioned just below it. The broader daily trend remains bullish, giving buyers an opportunity to regain control
At the same time, the U.S. Dollar Index is testing resistance. Profit-taking near the 101.5 area could trigger a pullback in the dollar, providing additional support for the Australian dollar.
From a technical perspective, a substantial liquidity pool has formed below 0.69615. A long squeeze in this area could trigger a rebound and support a continuation of the prevailing uptrend toward the next target zone
Resistance levels: 0.6994, 0.7010, 0.7021
Support level: 0.6960
A false breakout below 0.69615, followed by a recovery and sustained consolidation above this level, could become the technical catalyst for a rally toward 0.6994–0.7020
Best regards,
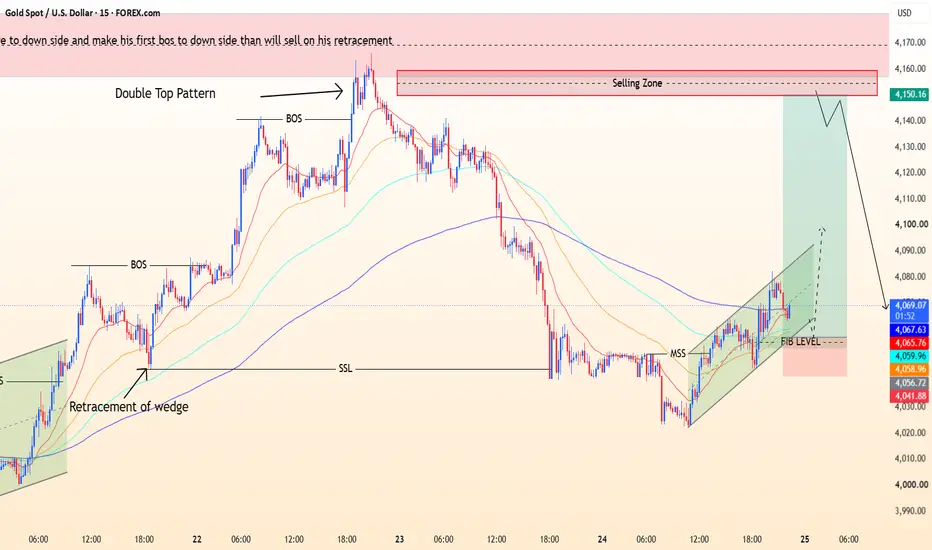
R. Linda XAU/USD Bullish Trade Setup Demand & Fib Confluence🔍 Technical Confluence Breakdown
⚡ Market Structure Shift (MSS): Price swept sell-side liquidity (SSL) around ~4,020 and broke structure to the upside, flipping short-term 15-minute momentum from bearish to bullish.
🎯 Premium Demand & Fib Zone (4,050 – 4,056): Retracements into the 0.72 – 0.78 Fibonacci levels align directly with lower channel support and fresh demand, offering a high-probability Optimal Trade Entry (OTE).
🏁 Profit Target & Major Resistance: Upside target points toward the 4,150–4,160 Selling Zone, where the prior double top and strong higher-timeframe resistance lie.
🛡️ Risk & Execution Parameters
🛑 Stop Loss / Invalidation: Placed around ~4,041 (just below the structural swing low).
⚖️ Risk-to-Reward Ratio: Entering near ~4,056 with a ~15-point stop and targeting ~4,150 (~94-point gain) yields an excellent > 1:6 R:R ratio.
⚠️ Disclaimer: This chart analysis is strictly for educational and informational purposes only. It is not financial advice or a signal to trade. Always perform your own analysis and practice strict risk management before opening any positions! 💸📊 Long 
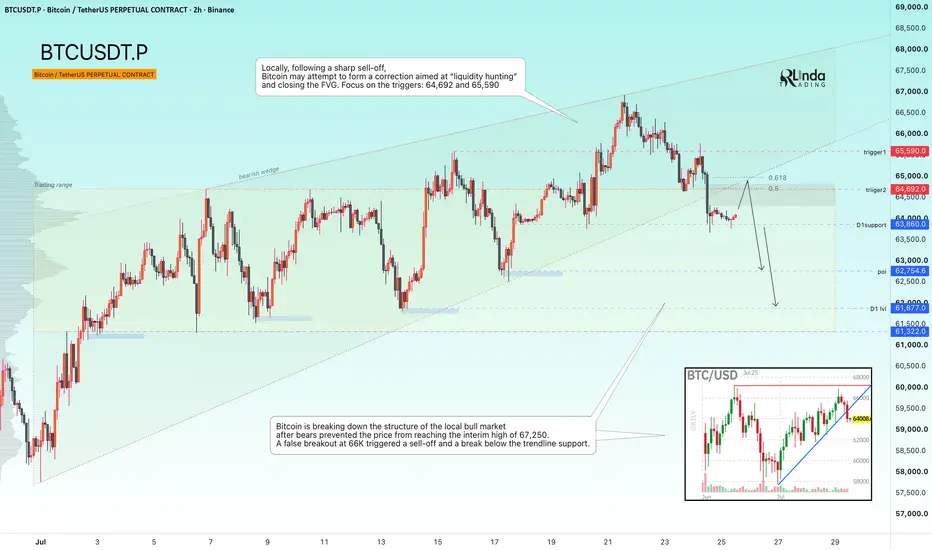
BITCOIN - A countertrend correction before a decline BINANCE:BTCUSDT.P is breaking the local bullish market structure within a broader bearish distribution phase while also forming a false breakdown below the 63,680 support area. The market continues to reinforce the dominance of the higher-timeframe bearish trend, although a corrective rebound remains possible before the next leg lower
Higher timeframe: The broader bearish trend remains intact. Sellers prevented price from reaching the key technical retracement level at 67,250, while a weak fundamental backdrop and continued ETF outflows continue to weigh on market sentiment.
From a technical perspective, Bitcoin has invalidated the local bullish structure after bears rejected the advance toward 67,250. The false breakout above 66K triggered a sharp sell-off and was followed by a break below the ascending trendline support
Resistance levels: 64,692, 65,590
Support levels: 63,860, 62,750, 61,322
Following the recent decline, Bitcoin may attempt a countertrend correction to sweep liquidity and fill the existing fair value gap. The primary focus remains on the 64,692 and 65,590 resistance levels. A short squeeze into this resistance zone could provide the technical setup for another bearish reversal toward the lower boundary of the current trading range
Best regards,
R. Linda  Short
Short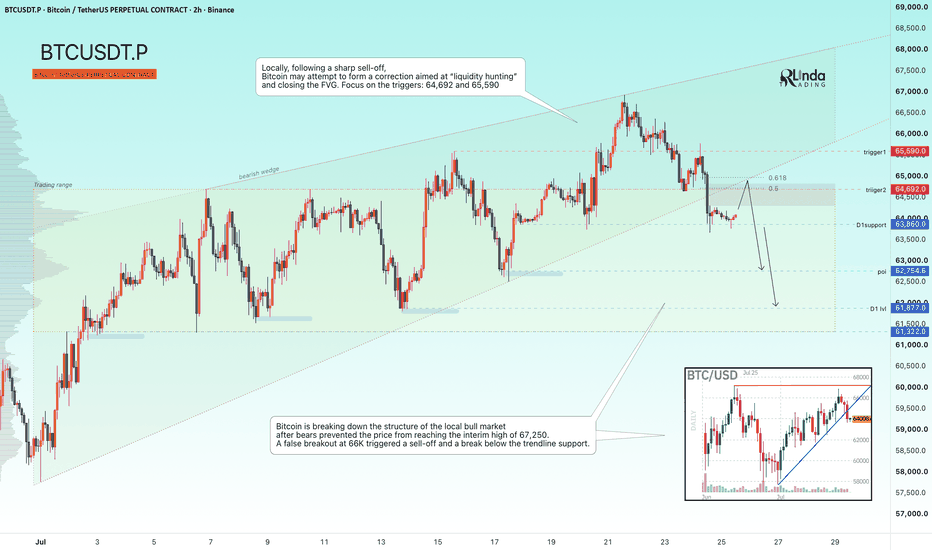
 Long
Long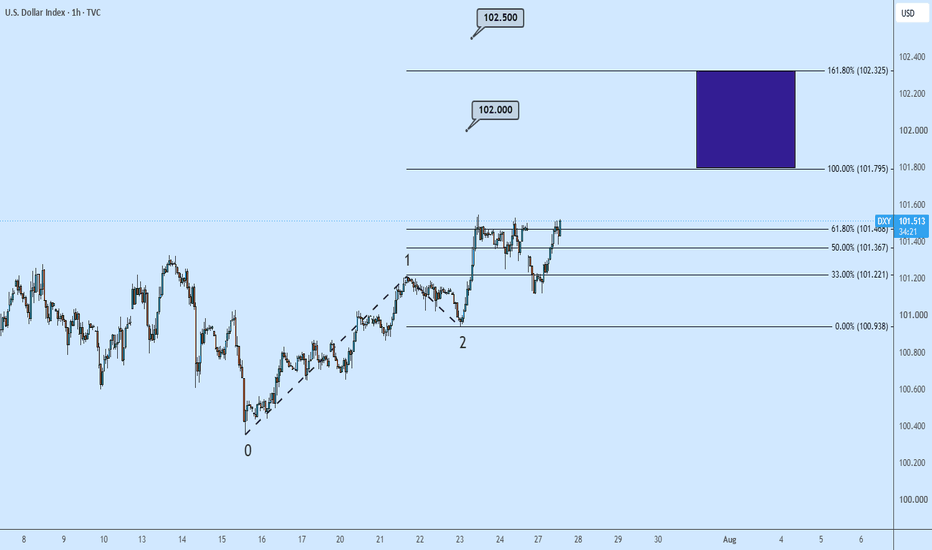
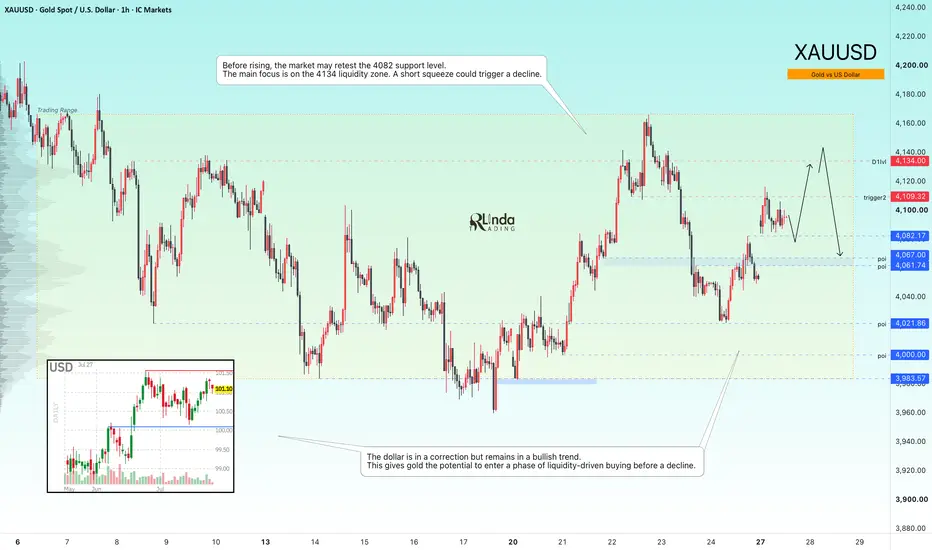
GOLD - Correction Before a Decline ICMARKETS:XAUUSD remains under pressure from the broader bearish trend. However, within this primary direction, the market is developing a sideways range and a countertrend correction. A stronger U.S. dollar could once again weigh on the metal
Gold has received temporary support from the recent geopolitical pause and a softer U.S. dollar. However, the sustainability of the recovery remains uncertain as markets await the upcoming Federal Reserve decision and further developments in the Middle East. Technical indicators continue to point to a bearish bias, limiting buyers' appetite.
Bullish drivers: Further U.S. dollar weakness, Geopolitical de-escalation, Lower oil prices and bond yields, A dovish signal from the Federal Reserve
Bearish drivers: Renewed geopolitical escalation, Rising oil prices, Hawkish Fed rhetoric, Renewed U.S. dollar strength
Resistance levels: 4109, 4134
Support levels: 4082, 4067, 4028
Although the U.S. dollar is currently in a corrective phase, its broader trend remains bullish. This could allow gold to complete a liquidity sweep before resuming its decline.
Before any further advance, gold may retest the 4082 support level. The primary focus remains on the 4134 liquidity zone, where a short squeeze could trigger another bearish reversal
Best regards,
R. Linda Short 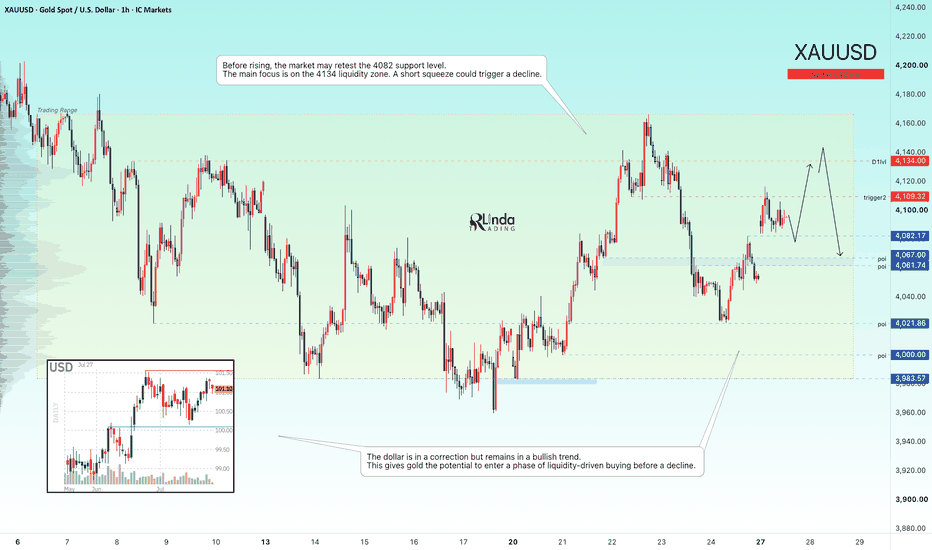
XAUUSD (H1) | Elliott Wave 3 Launchpad?
Key Support Zone At 4,055 - 4,060 Holds The Line
Gold (XAUUSD) continues to display exceptional structural strength on the H1 timeframe. Following the completion of a textbook (a)-(b)-(c) corrective cycle down to the structural floor, buyers have stepped in aggressively to defend key higher-lows.
With Pre-FOMC market dynamics causing selective positioning across major dollar pairs, Gold's order flow reveals a clear Bullish Accumulation / Re-accumulation pattern. As long as the market respects our critical invalidation threshold, the path of least resistance points toward a powerful Wave 3 impulsive expansion targeting structural liquidity above the all-time high zone.
2. Key Technical Levels & Wave Geometry
Invalidation Baseline: 4,022.000 – The non-negotiable structural anchor point. A breach below this invalidates the current bullish wave count.
Primary Accumulation Support Zone: 4,055.000 – 4,060.000 – Previous overhead resistance now flipped into a major Support/Demand block (Wave 2 completion area).
Immediate Breakout Resistance Zone: 4,115.000 – 4,118.000 – Key intermediate hurdle. A sustained H1 close above this level triggers the Wave 3 acceleration phase.
Major Overhead Target / Peak: 4,165.000 (Recent High) & 4,200.000+ (Wave 5 Extension Target).
3. Market Debate: Is Wave 3 Ready For Takeoff?
The Bullish Thesis (Buyers): The corrective phase (c) is fully exhausted at 4,022. The price action above 4,055 - 4,060 represents institutional re-accumulation. Once buyers break and hold above the 4,115 - 4,118 resistance layer, rapid algorithmic buying will squeeze bears and propel Gold past 4,165 toward 4,200.
The Bearish Thesis (Sellers): Overhead supply near 4,115 - 4,118 remains a stiff resistance zone. If sellers can defend this supply block and push price back below 4,055, it could force a deeper retest of the 4,022 invalidation level before any real macro rally can materialize.
💬 Are you buying the dip inside the 4,055 - 4,060 support zone or waiting for a confirmed H1 breakout above 4,118? Share your setup in the comments! Long 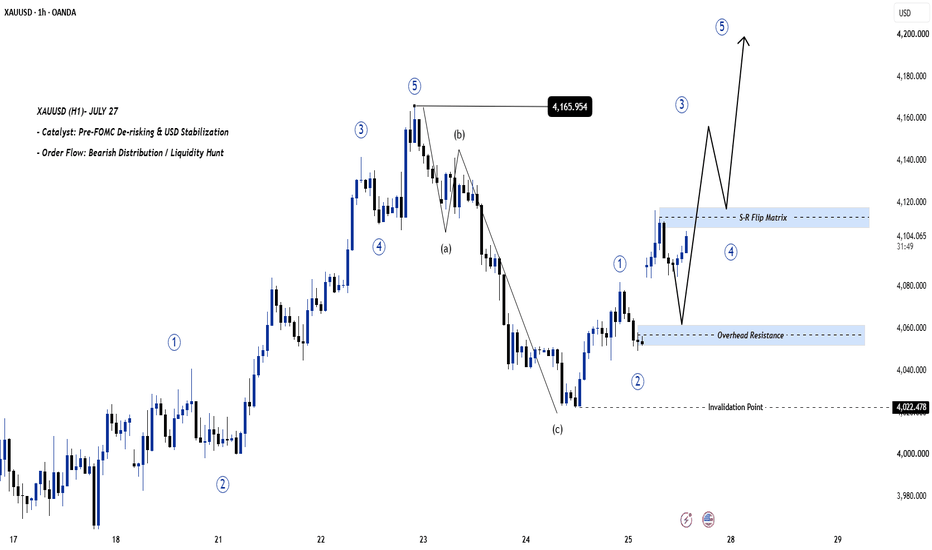
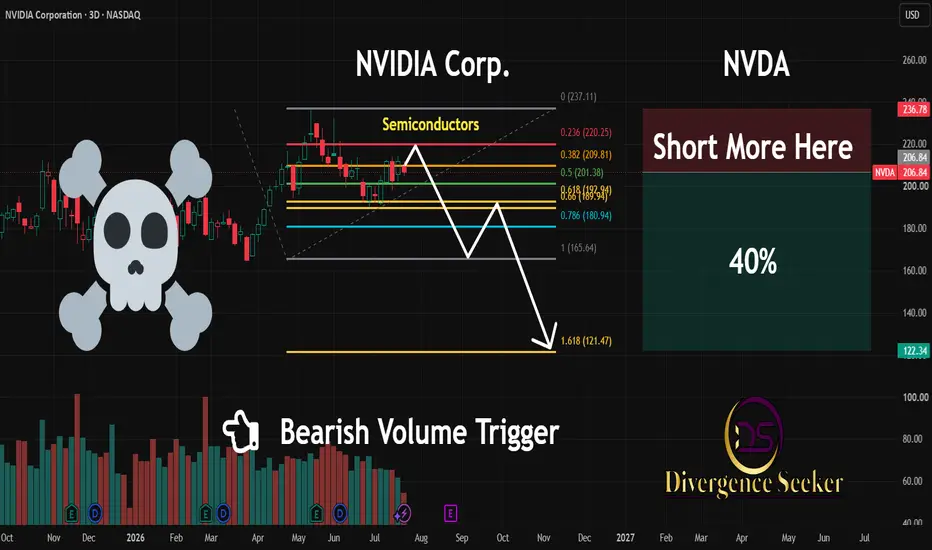
NVDA | Why the Rocket is Running Out of Fuel | SHORTNVIDIA (NVDA) stock has been going up like a rocket.
But today, I’m looking at the warning signs that it might take a big 40% drop.
If you are trying to explain to your family why everyone is so nervous about this computer chip company, and why it could actually hurt their retirement savings—here is what is going on in plain English.
1. The Rubber Band is Stretched Too Far
In stock charting, we use mathematical lines (called a Fibonacci channel) to find the "ceiling" and "floor" of a stock's price. Right now, NVIDIA has hit the absolute highest ceiling possible.
The Analogy: Imagine pulling a rubber band as far as it will go. You can stretch it a long way, but eventually, it has to snap back.
The Reality: NVIDIA has stretched all the way to its absolute limit on the charts. Historically, when it hits this ceiling, it snaps back down to its normal resting place. Right now, that "normal" place is about 40% lower than where we are today.
2. The Runner is Out of Breath
Even though the stock price is still going up, the energy behind it is dying. In the trading world, we call this a "bearish divergence."
The Analogy: Think of a runner sprinting up a steep hill. They are still moving upward, but they are gasping for air and their legs are giving out.
The Reality: The stock price is climbing, but the actual number of people willing to buy at these high prices is dropping fast. The stock is running entirely out of breath. When the energy runs out, gravity takes over.
3. The Global Tug-of-War
We also have to look at what is happening in the real world. NVIDIA relies heavily on other countries to build and buy their computer chips.
The Analogy: Imagine you run a very successful bakery, but the government suddenly says you are no longer allowed to buy flour from your main supplier because of a political argument. Your business would suffer instantly.
The Reality: The U.S. and other global superpowers are in a massive tug-of-war over technology. Governments are putting up strict rules about where these chips can be made and who is allowed to buy them. This makes it much harder and more expensive for NVIDIA to do business, which hurts their profits.
4. Why Your Pension and 401k Are in the Crosshairs
You might be thinking, "I don't own NVIDIA stock, so why should I care?" Here is the scary part: you probably do own it, and it could severely impact your retirement.
The Analogy (The Giant Watermelon): Imagine your retirement account is a fruit basket that is supposed to hold a healthy, equal mix of 500 different fruits. But recently, one giant watermelon (NVIDIA) has grown so huge that it takes up a massive amount of the basket's weight. If that watermelon rots and collapses, your whole basket gets significantly lighter.
The Reality: Most 401k plans and pensions rely on "Index Funds," which are designed to safely track the 500 largest companies in the U.S.. But because NVIDIA has grown so fast, it now makes up a huge chunk of these supposedly "safe" funds, sometimes over 8% of the entire basket. Because it takes up so much space, a 40% crash in NVIDIA alone is heavy enough to drag down your entire retirement portfolio.
Key insight: The heavier a single stock gets in an index fund, the more your "safe and diversified" retirement account starts acting like a risky bet on just one company.
Nothing goes up forever. When a stock stretches too far, runs out of energy, faces global problems, and dominates the stock market, it usually falls back down to earth. Check your 401k, understand what you actually own, and trade safely!  Short
Short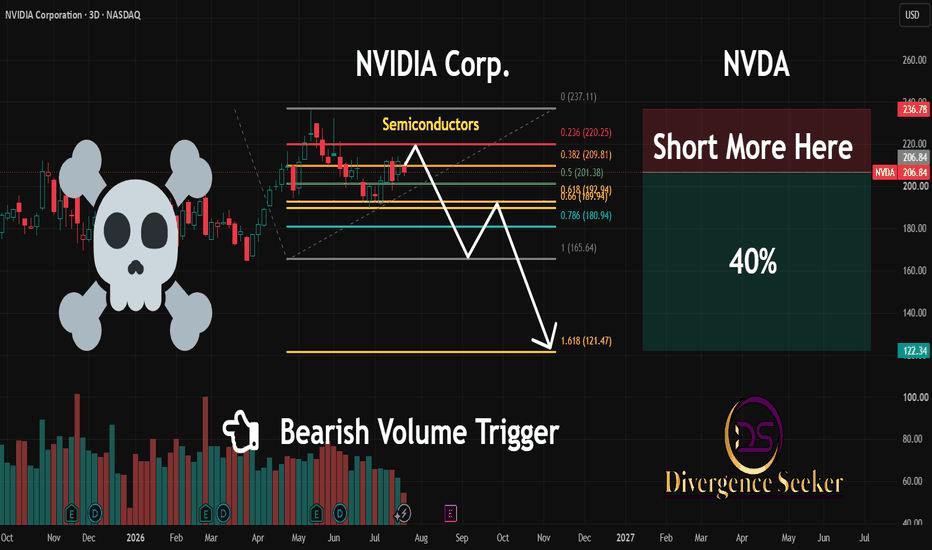
GOLD - The Hunt for Liquidity (Correction) Before the Drop ICMARKETS:XAUUSD is recovering after Thursday's sharp decline, trading around $4,060 on Friday. This rebound may represent nothing more than a liquidity-building move before the broader downtrend resumes
The U.S. dollar continues to strengthen, while gold remains under selling pressure, reinforcing the prevailing bearish market structure. The broader trend remains firmly bearish.
From a technical perspective, gold continues to face pressure from geopolitical uncertainty and hawkish Federal Reserve expectations. The current recovery appears to be a countertrend correction toward key liquidity zones, potentially building momentum for another decline toward the 4000–3983 support area. The next directional move will largely depend on the U.S. dollar, oil prices, PMI data, and developments surrounding the geopolitical conflict.
Bearish drivers: Stronger hawkish Fed expectations, Rising oil prices, Continued U.S. dollar strength, Profit-taking, Bearish technical structure
Bullish drivers: U.S. dollar weakness triggered by new tariff developments, Geopolitical de-escalation, Weaker-than-expected PMI data
Resistance levels: 4061, 4067, 4109
Support levels: 4021, 4000, 3983
Within the current countertrend correction, gold is testing the first trigger zone at 4061–4067. A short squeeze around this area could trigger another reversal and send price back toward support. However, a deeper correction toward the 4109–4134 liquidity zone before the next bearish leg cannot be ruled out
Best regards,
R. Linda Short 
Gold Outlook: FOMC to Trigger a $3,970 Flush?
1. Fundamental & Sentiment Macro Outlook
As we step into the final trading week of July, the Gold market (XAUUSD) is bracing for immense volatility driven by a stacked macroeconomic calendar. Heading into the crucial Federal Reserve Interest Rate Decision (FOMC) on Wednesday, alongside US Q2 GDP and PCE Inflation metrics on Thursday, institutional market participants are maintaining a defensive posture.
Macro liquidity is currently favoring a structured re-pricing. Ahead of major central bank rate announcements, high-frequency algorithms (HFTS) are driving price action to clear resting liquidity beneath key structural support levels. Unless a dovish monetary pivot or a geopolitical catalyst triggers a aggressive safe-haven bid, the near-term path of least resistance continues to lean toward a targeted bearish continuation down into deep institutional discount pools.
2. Key Technical Coordinates & Structural Mapping
Analyzing the H1 market geometry, here are the key technical zones defining our weekly playbook:
Unfilled Overhead FVG / Supply Ceiling: 4,070.000 – 4,080.000 – Premium imbalance gap created during the recent impulse breakdown. Acts as a strong resistance zone and primary bear defense line.
Intermediate Liquidity Checkpoint: 4,000.000 – 4,010.000 – Round-number psychological barrier and immediate structural support where short-term relief bounces may materialize.
Primary Demand & Liquidity Target: 3,970.000 – 3,980.000 – Major institutional liquidity matrix containing heavy resting buy-limit clusters and structural demand.
3. Weekly Market Debate & Execution Scenarios
Will the pre-FOMC volatility sweep price down into the $3,970 liquidity floor, or can buyers defend the $4,000 round number for an early trend reversal?
The Bearish Blueprint (Primary Scenario): The lower-high and lower-low sequence on the H1 timeframe remains intact. A sustained rejection beneath the $4,035 - $4,040 level will likely trigger a breakdown toward the $4,000 - $4,010 intermediate support. Following a minor corrective pull-back/retest, algorithmic selling momentum is projected to deliver a final expansion sweep straight into the $3,970 - $3,980 macro demand matrix.
The Bullish Blueprint (Alternative Scenario): If bulls aggressively defend the $4,000 psychological level with strong volume absorption and print a clear H1 Change of Character (CHOCH) back above $4,040, it will invalidate the immediate bearish continuation. This scenario opens the path for a relief rally back up to fill the overhead Fair Value Gap (FVG) around $4,070 - $4,080.
💬 How are you positioning your portfolio for FOMC Super Week? Are you selling the pullbacks toward $3,970 or waiting to buy the extreme discount sweep? Let us know your thoughts below!
Short