XAU/USD 23 July 2026 Intraday AnalysisH4 Analysis:
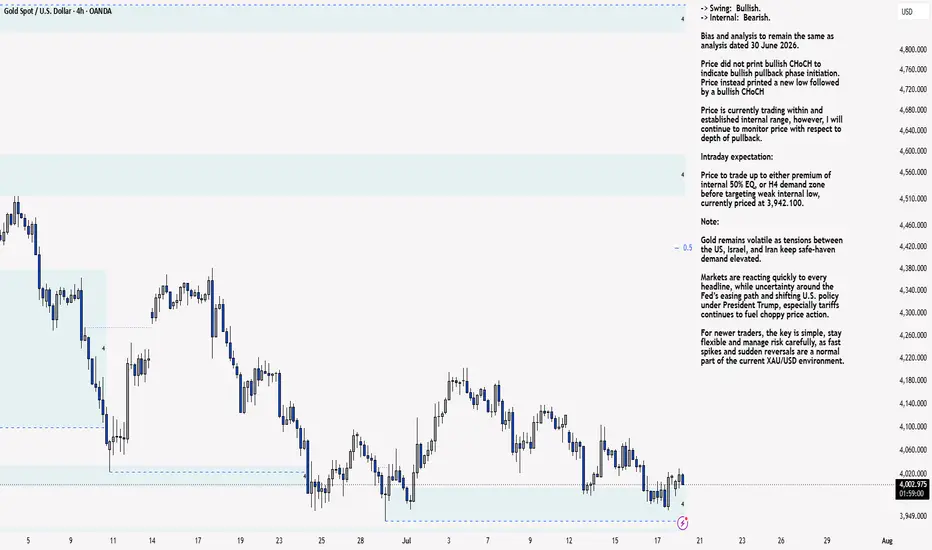
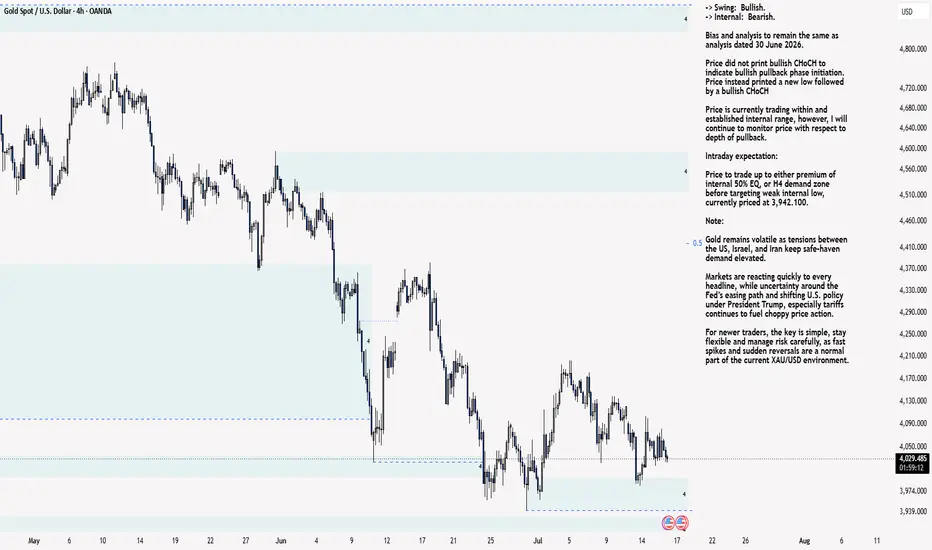
-> Swing: Bullish.
-> Internal: Bearish.
Bias and analysis to remain the same as analysis dated 30 June 2026.
Price did not print bullish CHoCH to indicate bullish pullback phase initiation. Price instead printed a new low followed by a bullish CHoCH
Price is currently trading within and established internal range, however, I will continue to monitor price with respect to depth of pullback.
Intraday expectation:
Price to trade up to either premium of internal 50% EQ, or H4 demand zone before targeting weak internal low, currently priced at 3,942.100.
Note:
Gold remains volatile as tensions between the US, Israel, and Iran keep safe‑haven demand elevated.
Markets are reacting quickly to every headline, while uncertainty around the Fed’s easing path and shifting U.S. policy under President Trump, especially tariffs continues to fuel choppy price action.
For newer traders, the key is simple, stay flexible and manage risk carefully, as fast spikes and sudden reversals are a normal part of the current XAU/USD environment.
H4 Chart:
M15 Analysis:
-> Swing: Bearish.
-> Internal: Bearish.
Analysis and bias remains the same as analysis dated 20 July 2026.
Price has printed according to analysis dated 14 July 2026 where I mentioned price to trade up to either premium of internal 50% EQ, or M15 demand zone before targeting weak internal low, priced at 3,983.545. This is how price printed.
Price has subsequently printed a bullish CHoCH to indicate bullish pullback phase initiation. Price has since printed lower. Depth of pullback has been insignificant, therefore, I will not classify the bearish iBOS, however, I have marked this in red for illustration purposes.
Price has since printed a further bullish CHoCH and once again price is trading within an established internal range, however, I shall again monitor price action with regards to depth of pullback.
Intraday expectation:
Price to trade up to either premium of internal 50% EQ, or M15 demand zone before targeting weak internal low, priced at 3,959.800.
Note:
Gold remains highly reactive on M15 as geopolitical risk continues to drive quick, headline‑led moves.
The tension between the US, Israel, and Iran is keeping safe‑haven demand elevated, with markets still sensitive to any sign of escalation.
At the same time, shifting US tariff policy under President Trump is adding extra uncertainty, fuelling sharp intraday swings and increasing the likelihood of sudden sentiment flips. Liquidity pockets and whipsaws remain common, making disciplined risk management essential.
Gold’s geopolitical premium is still firmly in place, and until tensions ease, short‑term volatility is likely to stay front‑loaded.
M15 Chart: XAU/USD 22 July 2026 Intraday AnalysisH4 Analysis:
-> Swing: Bullish.
-> Internal: Bearish.
Bias and analysis to remain the same as analysis dated 30 June 2026.
Price did not print bullish CHoCH to indicate bullish pullback phase initiation. Price instead printed a new low followed by a bullish CHoCH
Price is currently trading within and established internal range, however, I will continue to monitor price with respect to depth of pullback.
Intraday expectation:
Price to trade up to either premium of internal 50% EQ, or H4 demand zone before targeting weak internal low, currently priced at 3,942.100.
Note:
Gold remains volatile as tensions between the US, Israel, and Iran keep safe‑haven demand elevated.
Markets are reacting quickly to every headline, while uncertainty around the Fed’s easing path and shifting U.S. policy under President Trump, especially tariffs continues to fuel choppy price action.
For newer traders, the key is simple, stay flexible and manage risk carefully, as fast spikes and sudden reversals are a normal part of the current XAU/USD environment.
H4 Chart:
M15 Analysis:
-> Swing: Bearish.
-> Internal: Bearish.
Analysis and bias remains the same as analysis dated 20 July 2026.
Price has printed according to analysis dated 14 July 2026 where I mentioned price to trade up to either premium of internal 50% EQ, or M15 demand zone before targeting weak internal low, priced at 3,983.545. This is how price printed.
Price has subsequently printed a bullish CHoCH to indicate bullish pullback phase initiation. Price has since printed lower. Depth of pullback has been insignificant, therefore, I will not classify the bearish iBOS, however, I have marked this in red for illustration purposes.
Price has since printed a further bullish CHoCH and once again price is trading within an established internal range, however, I shall again monitor price action with regards to depth of pullback.
Intraday expectation:
Price to trade up to either premium of internal 50% EQ, or M15 demand zone before targeting weak internal low, priced at 3,959.800.
Note:
Gold remains highly reactive on M15 as geopolitical risk continues to drive quick, headline‑led moves.
The tension between the US, Israel, and Iran is keeping safe‑haven demand elevated, with markets still sensitive to any sign of escalation.
At the same time, shifting US tariff policy under President Trump is adding extra uncertainty, fuelling sharp intraday swings and increasing the likelihood of sudden sentiment flips. Liquidity pockets and whipsaws remain common, making disciplined risk management essential.
Gold’s geopolitical premium is still firmly in place, and until tensions ease, short‑term volatility is likely to stay front‑loaded.
M15 Chart:  Short
Short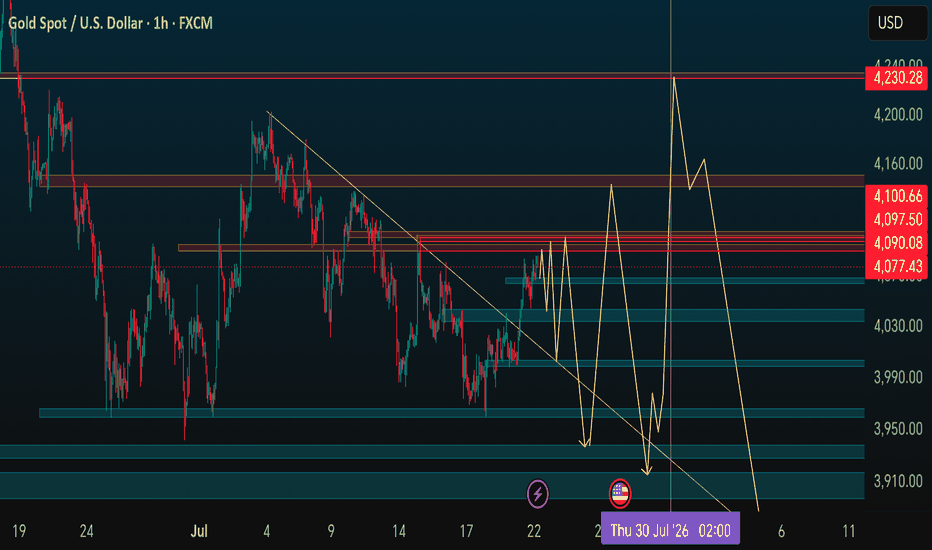
 Short
Short
 Long
Long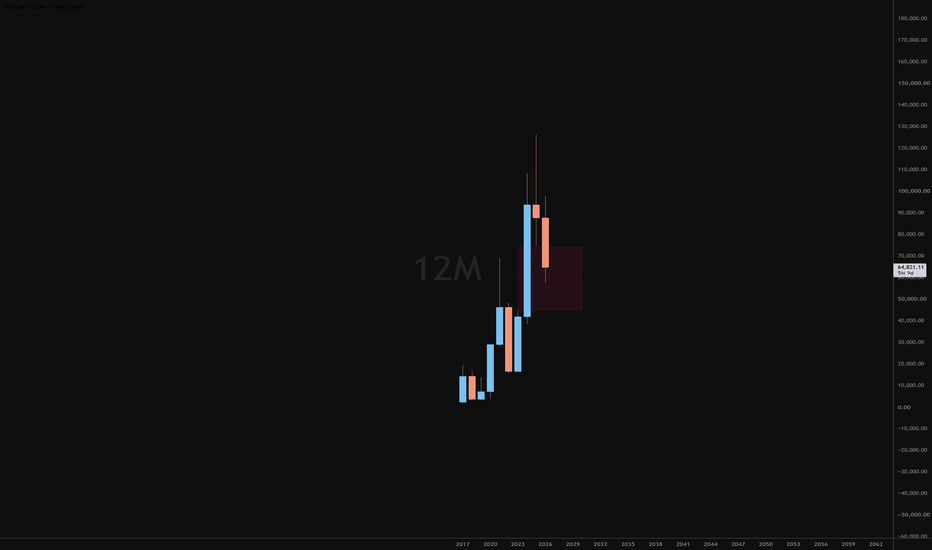
Short 
 Long
Long
Long 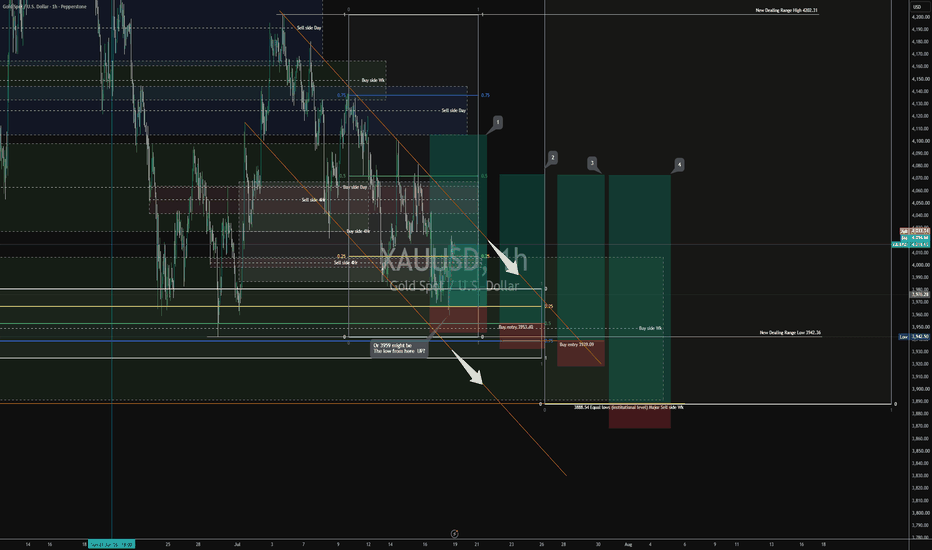
Long 
XAU/USD 20 July 2026 Intraday AnalysisH4 Analysis:
-> Swing: Bullish.
-> Internal: Bearish.
Bias and analysis to remain the same as analysis dated 30 June 2026.
Price did not print bullish CHoCH to indicate bullish pullback phase initiation. Price instead printed a new low followed by a bullish CHoCH
Price is currently trading within and established internal range, however, I will continue to monitor price with respect to depth of pullback.
Intraday expectation:
Price to trade up to either premium of internal 50% EQ, or H4 demand zone before targeting weak internal low, currently priced at 3,942.100.
Note:
Gold remains volatile as tensions between the US, Israel, and Iran keep safe‑haven demand elevated.
Markets are reacting quickly to every headline, while uncertainty around the Fed’s easing path and shifting U.S. policy under President Trump, especially tariffs continues to fuel choppy price action.
For newer traders, the key is simple, stay flexible and manage risk carefully, as fast spikes and sudden reversals are a normal part of the current XAU/USD environment.
H4 Chart:
M15 Analysis:
-> Swing: Bearish.
-> Internal: Bearish.
Price has printed according to analysis dated 14 July 2026 where I mentioned price to trade up to either premium of internal 50% EQ, or M15 demand zone before targeting weak internal low, priced at 3,983.545. This is how price printed.
Price has subsequently printed a bullish CHoCH to indicate bullish pullback phase initiation. Price has since printed lower. Depth of pullback has been insignificant, therefore, I will not classify the bearish iBOS, however, I have marked this in red for illustration purposes.
Price has since printed a further bullish CHoCH and once again price is trading within an established internal range, however, I shall again monitor price action with regards to depth of pullback.
Intraday expectation:
Price to trade up to either premium of internal 50% EQ, or M15 demand zone before targeting weak internal low, priced at 3,959.800.
Note:
Gold remains highly reactive on M15 as geopolitical risk continues to drive quick, headline‑led moves.
The tension between the US, Israel, and Iran is keeping safe‑haven demand elevated, with markets still sensitive to any sign of escalation.
At the same time, shifting US tariff policy under President Trump is adding extra uncertainty, fuelling sharp intraday swings and increasing the likelihood of sudden sentiment flips. Liquidity pockets and whipsaws remain common, making disciplined risk management essential.
Gold’s geopolitical premium is still firmly in place, and until tensions ease, short‑term volatility is likely to stay front‑loaded.
M15 Chart: Short 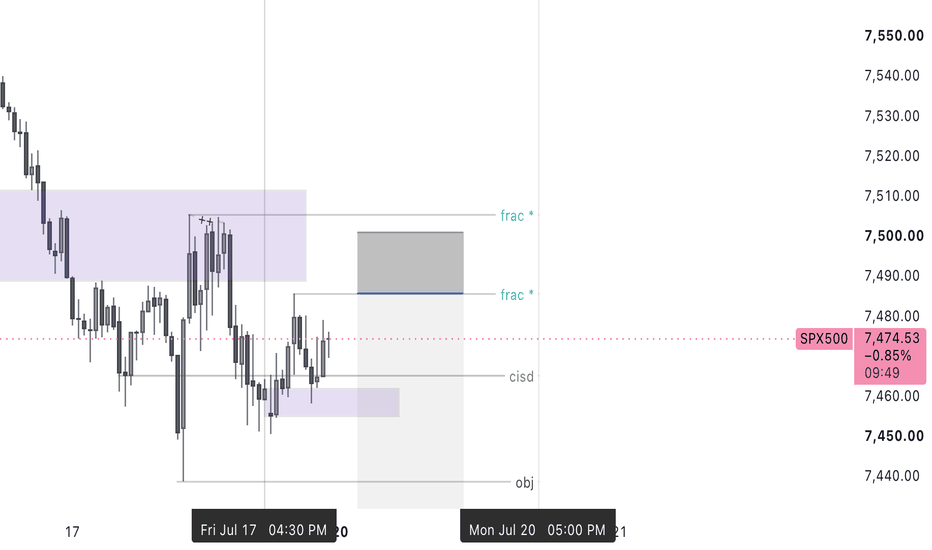
Long trade
Pair: BTCUSD
Direction: 🟢 Buyside
Model: DRT Buyside Raid → FVG Reclaim → Range Expansion
Date: Fri 17th July 26
Session: London AM
Entry Time: 7:00 AM
Entry: 63,609.54
Target / Profit Level: 64,798.05
Stop: 62,571.45
Gain Target: 2.74%
Risk: 0.73%
RR: 3.47
🧠 DRT Bias
🟢 Bias: Buyside while price holds above 62,571.45
BTC has already swept down into the lower internal range and tapped the buy-side FVG / daily imbalance support area. The long idea comes from price defending that discount zone and attempting to rotate back into the next imbalance above.
🧭SNAP MAP
The weekly range created major high and major low boundaries
→ Price traded from the June low into a mid-to-premium range
→ Recent move swept lower into the 4H sell-side imbalance zone
→ Buy-side FVG / daily FVG became the support base
→ Entry at 63,609.54 is the reclaim level
→ Target is 64,798.05, sitting near the next 1H sell-side FVG / imbalance
Best management: take 64,798.05 as the first pay zone. If BTC breaks and holds above it, then 65,266–65,600 becomes the next expansion target. If price fails below 63,609.54, the setup becomes weak; if it loses 62,571.45, the long is dead. Long 
 Short
Short
XAU/USD 17 July 2026 Intraday AnalysisH4 Analysis:
-> Swing: Bullish.
-> Internal: Bearish.
Bias and analysis to remain the same as analysis dated 30 June 2026.
Price did not print bullish CHoCH to indicate bullish pullback phase initiation. Price instead printed a new low followed by a bullish CHoCH
Price is currently trading within and established internal range, however, I will continue to monitor price with respect to depth of pullback.
Intraday expectation:
Price to trade up to either premium of internal 50% EQ, or H4 demand zone before targeting weak internal low, currently priced at 3,942.100.
Note:
Gold remains volatile as tensions between the US, Israel, and Iran keep safe‑haven demand elevated.
Markets are reacting quickly to every headline, while uncertainty around the Fed’s easing path and shifting U.S. policy under President Trump, especially tariffs continues to fuel choppy price action.
For newer traders, the key is simple, stay flexible and manage risk carefully, as fast spikes and sudden reversals are a normal part of the current XAU/USD environment.
H4 Chart:
M15 Analysis:
-> Swing: Bearish.
-> Internal: Bearish.
Price has printed according to analysis dated 14 July 2026 where I mentioned price to trade up to either premium of internal 50% EQ, or M15 demand zone before targeting weak internal low, priced at 3,983.545. This is how price printed.
Price has subsequently printed a bullish CHoCH to indicate bullish pullback phase initiation.
Price is currently trading within an established internal range, however, I shall monitor price action with regards to depth of pullback.
Intraday expectation:
Price to trade up to either premium of internal 50% EQ, or M15 demand zone before targeting weak internal low, priced at 3,969.345.
Note:
Gold remains highly reactive on M15 as geopolitical risk continues to drive quick, headline‑led moves.
The tension between the US, Israel, and Iran is keeping safe‑haven demand elevated, with markets still sensitive to any sign of escalation.
At the same time, shifting US tariff policy under President Trump is adding extra uncertainty, fuelling sharp intraday swings and increasing the likelihood of sudden sentiment flips. Liquidity pockets and whipsaws remain common, making disciplined risk management essential.
Gold’s geopolitical premium is still firmly in place, and until tensions ease, short‑term volatility is likely to stay front‑loaded.
M15 Chart:  Long
Long
Bitcoin, Gold, and the Digital Gold CycleBitcoin, Gold, and the Digital Gold Cycle: Breakdown or Final Accumulation?
The idea of Bitcoin as "Digital Gold" has become increasingly popular over the past few years. However, this comparison often remains superficial. What matters more is how Bitcoin's behavior has gradually evolved to resemble gold across long term market cycles.
Looking at Bitcoin's monthly structure today, the market is once again testing the long term ascending support that has been in place since 2021. Interestingly, this structure resembles two different periods in gold's historical price behavior. The objective is not to claim that Bitcoin will copy gold. The more important observation is that scarce global assets often go through remarkably similar phases of support tests, breakdowns, accumulation periods, structural resets, and eventual repricing.
During the 1970 to 1980 period, gold spent a long time interacting with its rising support before eventually breaking below it and entering a significant correction. That breakdown did not mark the end of gold's long term story. Instead, it became one of the most stressful reset phases before an extraordinary repricing cycle. The lesson is simple. Even the strongest assets can appear technically broken before their largest advances. Markets create fear, punish early believers, and only afterward transition into their true expansion phase.
Gold's behavior between 2010 and 2026 tells a different story. After years of sideways and downward pressure following the 2011 peak, gold gradually returned to its primary structural support around 2020. That support held, and the market entered a much stronger, more durable, and institutionally driven advance. This was no longer merely a speculative rally. It resembled the repricing of an asset that had spent years building a new foundation.
Bitcoin now stands somewhere between these two historical examples. One possibility resembles the 1970s, where the long term support ultimately fails, leading to a deeper correction before the next major cycle begins. The other resembles the more recent gold cycle, where an extended accumulation period and successful support test become the foundation for a new structural advance.
This is where the discussion becomes particularly important.
Bitcoin is no longer priced solely as a high risk asset. It is increasingly being valued as a globally recognized scarce reserve asset, a form of digital gold. As a result, its cycle behavior may gradually shift away from purely retail driven speculation toward a market increasingly influenced by institutional capital, long term custody, sovereign interest, and reserve allocation narratives..For that reason, today's support test is more than a simple technical event. It is a test of Bitcoin's evolving market identity.
If Bitcoin successfully defends this long term structure, the move should not simply be interpreted as another bounce from support. Within the broader cycle, it could become an important cycle location signal indicating that Bitcoin is beginning to behave more like a mature scarce asset than a traditional speculative instrument.
It is equally important to remain objective.
This chart does not guarantee that Bitcoin will move higher.
Instead, it presents two historically recognizable paths. first is a structural breakdown followed by a deeper reset. The second is a successful defense of long term support followed by an extended repricing phase. Today, the market sits precisely between those two possibilities. That is why asking only, "Where is the next bottom?" misses the larger picture. more meaningful question may be this:
Is Bitcoin experiencing its final major stress phase similar to gold during the 1970s, or is it building the foundation for a structural expansion similar to gold after 2010?
If long term support is ultimately lost and price establishes itself below this region, Bitcoin's intermediate structure would weaken, opening the door to a deeper reset.
However, if support continues to hold, price regains momentum, and buyers successfully reclaim the higher structure, today's weakness may eventually be viewed very differently.
Rather than being remembered as the beginning of a collapse, this region could become known as the final major accumulation zone where Bitcoin's Digital Gold narrative truly began to mature.
History shows that gold's largest advances rarely started when confidence was high.
They began when the structure looked exhausted, support was under pressure, confidence was fading, and most participants had lost patience.Bitcoin now faces a remarkably similar question.
Is this structure genuinely breaking down, or is the market simply testing investors' conviction one final time before the next major cycle begins? That, in my view, is what this chart is really trying to tell us. Bitcoin is not merely testing a price level.
It is testing the long term credibility of its Digital Gold identity.
If this structure ultimately holds, today's weakness may one day be remembered not simply as another fearful correction, but as one of the defining moments when Bitcoin's market behavior became most comparable to gold's long term historical cycles.
At a time when most investors are asking, "Where is the next bottom?", perhaps the more important question is this:
Is this the final breakdown and stress phase seen in gold during the 1970s, or the final accumulation zone that preceded gold's structural repricing after 2010?
Either way, Bitcoin appears to be navigating this critical region in its own unique manner while preparing for its next major phase.
The structure developing here could ultimately become one of the defining moments that determines whether Bitcoin will be valued primarily as another risk asset, or whether it will fully establish itself as the world's first true digital gold.
Long 
XAU/USD 16 July 2026 Intraday AnalysisH4 Analysis:
-> Swing: Bullish.
-> Internal: Bearish.
Bias and analysis to remain the same as analysis dated 30 June 2026.
Price did not print bullish CHoCH to indicate bullish pullback phase initiation. Price instead printed a new low followed by a bullish CHoCH
Price is currently trading within and established internal range, however, I will continue to monitor price with respect to depth of pullback.
Intraday expectation:
Price to trade up to either premium of internal 50% EQ, or H4 demand zone before targeting weak internal low, currently priced at 3,942.100.
Note:
Gold remains volatile as tensions between the US, Israel, and Iran keep safe‑haven demand elevated.
Markets are reacting quickly to every headline, while uncertainty around the Fed’s easing path and shifting U.S. policy under President Trump, especially tariffs continues to fuel choppy price action.
For newer traders, the key is simple, stay flexible and manage risk carefully, as fast spikes and sudden reversals are a normal part of the current XAU/USD environment.
H4 Chart:
M15 Analysis:
-> Swing: Bearish.
-> Internal: Bearish.
Bias and Analysis to remain the same as analysis dated 14 July 2026.
Price has printed according to analysis dated 14 July 2026 where I mentioned in alternative scenario that due to H4 internal structure being bearish, price could potentially target strong internal low and print a bearish iBOS.
Price subsequently printed a bearish iBOS and bullish CHoCH to indicate bullish pullback phase initiation.
Price is currently trading within a established internal range, however, I shall monitor price action with regards to depth of pullback.
Intraday expectation:
Price to trade up to either premium of internal 50% EQ, or M15 demand zone before targeting weak internal low, priced at 3,983.545.
Note:
Gold remains highly reactive on M15 as geopolitical risk continues to drive quick, headline‑led moves.
The tension between the US, Israel, and Iran is keeping safe‑haven demand elevated, with markets still sensitive to any sign of escalation.
At the same time, shifting US tariff policy under President Trump is adding extra uncertainty, fuelling sharp intraday swings and increasing the likelihood of sudden sentiment flips. Liquidity pockets and whipsaws remain common, making disciplined risk management essential.
Gold’s geopolitical premium is still firmly in place, and until tensions ease, short‑term volatility is likely to stay front‑loaded.
M15 Analysis:
-> Swing: Bearish.
-> Internal: Bearish.
Bias and Analysis to remain the same as analysis dated 14 July 2026.
Price has printed according to analysis dated 14 July 2026 where I mentioned in alternative scenario that due to H4 internal structure being bearish, price could potentially target strong internal low and print a bearish iBOS.
Price subsequently printed a bearish iBOS and bullish CHoCH to indicate bullish pullback phase initiation.
Price is currently trading within a established internal range, however, I shall monitor price action with regards to depth of pullback.
Intraday expectation:
Price to trade up to either premium of internal 50% EQ, or M15 demand zone before targeting weak internal low, priced at 3,983.545.
Note:
Gold remains highly reactive on M15 as geopolitical risk continues to drive quick, headline‑led moves.
The tension between the US, Israel, and Iran is keeping safe‑haven demand elevated, with markets still sensitive to any sign of escalation.
At the same time, shifting US tariff policy under President Trump is adding extra uncertainty, fuelling sharp intraday swings and increasing the likelihood of sudden sentiment flips. Liquidity pockets and whipsaws remain common, making disciplined risk management essential.
Gold’s geopolitical premium is still firmly in place, and until tensions ease, short‑term volatility is likely to stay front‑loaded.
M15 Chart: Short 
Short 
XAU/USD 15 July 2026 Intraday AnalysisH4 Analysis:
-> Swing: Bullish.
-> Internal: Bearish.
Bias and analysis to remain the same as analysis dated 30 June 2026.
Price did not print bullish CHoCH to indicate bullish pullback phase initiation. Price instead printed a new low followed by a bullish CHoCH
Price is currently trading within and established internal range, however, I will continue to monitor price with respect to depth of pullback.
Intraday expectation:
Price to trade up to either premium of internal 50% EQ, or H4 demand zone before targeting weak internal low, currently priced at 3,942.100.
Note:
Gold remains volatile as tensions between the US, Israel, and Iran keep safe‑haven demand elevated.
Markets are reacting quickly to every headline, while uncertainty around the Fed’s easing path and shifting U.S. policy under President Trump, especially tariffs continues to fuel choppy price action.
For newer traders, the key is simple, stay flexible and manage risk carefully, as fast spikes and sudden reversals are a normal part of the current XAU/USD environment.
H4 Chart:
M15 Analysis:
-> Swing: Bearish.
-> Internal: Bearish.
Bias and Analysis to remain the same as analysis dated 14 July 2026.
Price has printed according to analysis dated 14 July 2026 where I mentioned in alternative scenario that due to H4 internal structure being bearish, price could potentially target strong internal low and print a bearish iBOS.
Price subsequently printed a bearish iBOS and bullish CHoCH to indicate bullish pullback phase initiation.
Price is currently trading within a established internal range, however, I shall monitor price action with regards to depth of pullback.
Intraday expectation:
Price to trade up to either premium of internal 50% EQ, or M15 demand zone before targeting weak internal low, priced at 3,983.545.
Note:
Gold remains highly reactive on M15 as geopolitical risk continues to drive quick, headline‑led moves.
The tension between the US, Israel, and Iran is keeping safe‑haven demand elevated, with markets still sensitive to any sign of escalation.
At the same time, shifting US tariff policy under President Trump is adding extra uncertainty, fuelling sharp intraday swings and increasing the likelihood of sudden sentiment flips. Liquidity pockets and whipsaws remain common, making disciplined risk management essential.
Gold’s geopolitical premium is still firmly in place, and until tensions ease, short‑term volatility is likely to stay front‑loaded.
M15 Chart: