SPX gamma map - Nov 2: opens above 7524 flip, 7650 0DTE capSPX opened near 7616, about 1.2% above the 7524 gamma flip, in a dampening (positive gamma) regime. Expected move for the day is about 0.48% either way, VIX 18.9. A major manufacturing release lands 30 minutes after the open and open-interest gamma shifted a lot since Friday, so the first half hour is treated as noise before the map is trusted.
Key levels (index prices, lines on the chart): 7650 is the 0DTE call resistance, with the 1-day cone high at 7653 sitting right on top of it. 7660 and 7
Gamma
SPX gamma map — Oct 30: gap-down into 7590-7668 cone, 7705 capsSPX gapped lower to about 7625 at the open (-1.2% on the day), VIX 18.9 (+10%), expected move ±0.51%. The regime reads dampening on same-day flow, but open-interest gamma is negative across the whole band around price: the two readings disagree, so the positive-gamma cushion is thin and tends to fade into the close.
Key levels (index), lines on the chart: 7705 is the 0DTE call resistance and today's ceiling (8100 is the far monthly call wall). 7668 is the 1-day cone high. 7635 and 7600 are nega
AAPL GEX - Relative Strength at the 350 Call WallAAPL is holding up better than the mega-cap tape. MSFT and GOOGL are under pressure, while AAPL is testing the November 20 cumulative call wall at 350. Spot is 350.25 — pressed against that strike, not yet accepted above it.
Price is trading above the 50 SMA and the 200 SMA, so the higher-timeframe trend is still intact while the options map decides the next step at 350.
🔶 Regime Context 🔶
Spot is above HVL at 345, which keeps AAPL in a positive GEX regime. The call cluster starts at 347.5, an
SPX gamma map — Oct 27: 7720 0DTE call wall caps a 0.35% coneSPX ~7702 (+0.3%) in a dampening regime (positive gamma), 1-day expected move about ±0.35%, VIX 17.9. FOMC decision tomorrow, and a macro release at 15:00 CET lands within 30 minutes of the open, so the first half hour is the riskiest window of the session.
Key levels (index), lines on the chart: 0DTE call wall 7720 (red) — the one that matters today, less than 0.25% above spot; the all-expiries call resistance 8100 is far away. Put support 7650 (green) — gamma demand zone that cushions the down
Understanding SpaceX and Long Dated Options NASDAQ:SPCX LEAPS and the IV problem
NASDAQ:SPCX ’s longest-dated options are interesting because they give us long-duration exposure while the IV history is almost nonexistent . This will be the beginning of my analysis on SpaceX and their operations.
Understanding long-dated options
LEAPS stands for Long-Term Equity Anticipation Securities. They are long-dated options, generally issued with more than one year until expiry .
They are commonly used for:
Long-term directional po
AMD GEX - Sitting on the 530 Put WallAMD has pulled back to the 530 put wall on the November 20 cumulative profile. After the rejection from 620, price is back in the band that capped the chart before the last push higher. That former ceiling can act as support on this retest. Whether it holds is still open.
Spot is near 542, so the close is just above 530 and just under the 545 regime pivot. The level that matters is the reaction at 530.
🔶 Regime Context 🔶
On the November 20 cumulative profile (31 DTE), price is inside the trans
JPM – Holding Above HVL into Earnings, 345 Call Wall in FocusJPM is holding the bounce from the 330 HVL regime pivot on the daily chart, with earnings due Tuesday. Spot sits in a positive GEX regime above HVL, just through the start of the call cluster, with the dominant call wall still overhead at 345.
🔶 Regime Context 🔶
Price is trading above 330 – HVL , keeping JPM inside a positive GEX regime. The call cluster starts at 332.5 (cTrans) ; spot is just above that line and still below C1. GEX History on the daily is aligned positive across 0 / W1 / M1
Liquidity & Policy Drivers: The Top-Down Market Anchor (PART 2)While top-down macro liquidity sets the direction, Options Market Microstructure governs local volatility, market-maker hedging behavior, and tail-risk pricing.
Here is how we read the three core options market indicators shown on the chart:
⚙️ 1. Options Microstructure Framework
- Condor Index (CNDR): Measures range-bound market behavior. Higher values indicate low realized directional trend, favoring non-directional yield strategies such as Iron Condors or Short Straddles.
- Gamma
Double Bounce at 340, 370 Call Wall NextAVGO is attempting a structural turn after defending the 340 put wall twice on the daily chart.
The latest bounce has carried price back above the 352.5 HVL and into the lower edge of the call cluster. With spot near 355.47, AVGO is only marginally inside positive GEX territory—making acceptance above HVL more important than the initial reclaim itself.
🔶 Regime Context 🔶
The November 20 cumulative profile places HVL at 352.5 and the start of the call cluster at 355. Price has reclaimed both le
AAPL GEX – Bounce from 330 HVL, 340 Call Wall OverheadAAPL is attempting to turn a controlled pullback into continuation after reclaiming the 330 volatility regime pivot. On the November 20 cumulative GEX profile (51 DTE), price near 337 remains above HVL but below the dominant 340 call wall.
This places AAPL inside the positive side of the transition zone. The immediate test is whether momentum can convert the bounce into acceptance above the concentrated options structure at 340.
🔶 Regime Context 🔶
Holding above 330 keeps AAPL in a positive GEX
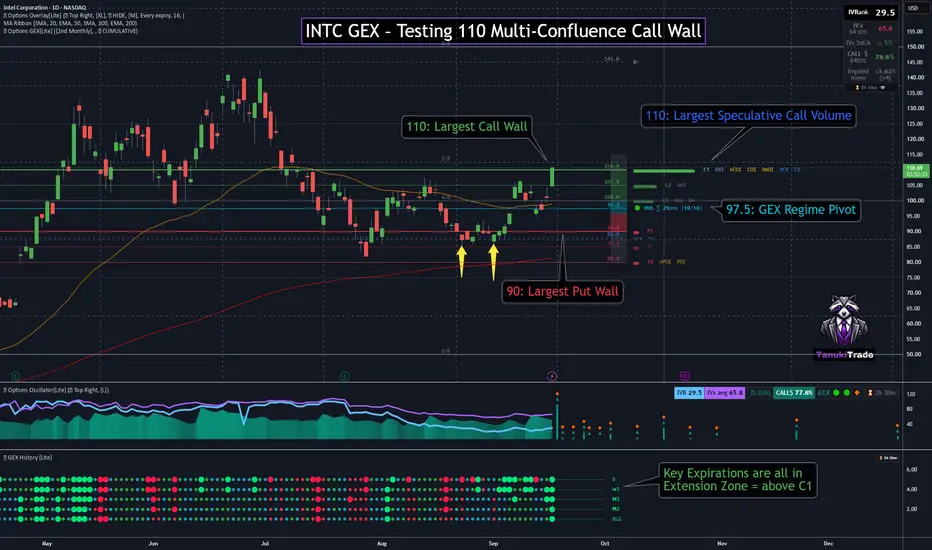
INTC GEX – Testing 110 Multi-Confluence Call WallINTC is pressing into 110 on the daily chart after a strong momentum expansion. Spot is only marginally above the level, so this remains a test rather than confirmed acceptance.
The October 16 cumulative GEX profile makes 110 the central decision point. It is the highest call wall and also overlaps a technically important reaction area visible on the daily chart.
🔶 Regime Context 🔶
With price above the 97.5 HVL and the 100 call-cluster boundary, INTC remains in a positive GEX regime.
GEX Hist
SPX gamma map — Sep 14: below the 7671 flip, 7800 call wallSPX opens near 7657, about 0.8% below the all-expiries gamma flip at ~7671, in an amplifying regime: net dealer gamma from open interest is deeply negative. VIX 17.6 (+11% overnight), expected move about ±0.43%. No US data today; Fed decision Wednesday, quarterly expiry Friday.
Key levels (index prices, lines on the chart): call wall / resistance 7800 (red) is the structural cap, with OI magnets stacked at 7750, 7775 and 7790 on the way up. The prior-session call wall at 7710 is still backed by
INTC – Bounce from 85 Put Wall, Watching 100 Call WallINTC is bouncing off the 85 put wall on the daily chart, with price now holding near 95.61 after reclaiming the 90 HVL. On the October 16 cumulative GEX Profile, that keeps INTC in a positive GEX regime (spot above HVL) and inside the call cluster above 93 (cTrans). The 100 call wall is still overhead — this is not yet a positive-extension story on that swing profile.
🔶 Regime Context 🔶
Price is trading above HVL at 90 , so the regime read is positive. GEX History on the daily is an all-gr
SPX gamma map — Sep 4: 7740-7750 pin into NFP, weekly expiryPre-market snapshot: SPX 7748, positive-gamma (dampening) regime, expected move ±0.68% (about ±53 pts), VIX 14.2, VIX1D 10.8. Net dealer gamma jumped more than 10% overnight. The August jobs report lands at 8:30 ET, an hour before the cash open, so the first hour trades on a print the market has not digested yet: the pre-open checklist is red (macro print pending + spot pinned inside a 10-point cluster) and the map gets reassessed once that first hour is done.
Lines on the chart: call wall 7750
SPX gamma map — Sep 3: soft 7660 put wall, 7800 call wall capsSPX cash 7667, with futures about 0.25% above the gamma flip, so the session opens on the dampening (positive-gamma) side. Expected move ±0.66%, VIX 15.2, VIX1D 10.4. Pre-market read: dealer positioning is unchanged since yesterday's close, so this map is inherited structure until the first 0DTE prints rebuild it after the open.
Key levels (index), lines on the chart:
- Call resistance 7800 (red) — structural call wall, dealers sell into rallies here; open-interest magnets above it at 7825 and
How gamma walls & the HVL flip frame the SPX sessionEducational post: a simple way to frame an SPX session with dealer-gamma levels (the three horizontal lines on the chart are today's levels). Nothing here is a trade call.
1) Call wall — the strike above spot with the largest call gamma (7800 today). Dealers are long gamma there and sell into rallies, so it behaves as a ceiling / rally-fade zone and often marks the upper edge of the day's range.
2) Put wall / gamma support — the strike below spot with the largest put or positive gamma (the 0DT
BIDU GEX - Positioning Before EarningsBIDU reports earnings tomorrow before the open, and the August 21 expiration (4 DTE) is the options window covering that print.
Price is trading near 102.5, just below HVL at 103, which keeps BIDU in a more reactive GEX regime. That places spot at the top of a wide put cluster — P2 at 101 and P3 at 100 — with the main call wall still overhead at 110.
What stands out is the split between pricing and flow. CALL$ is 84.1%, so calls are priced much richer than puts. Despite that, put volume below
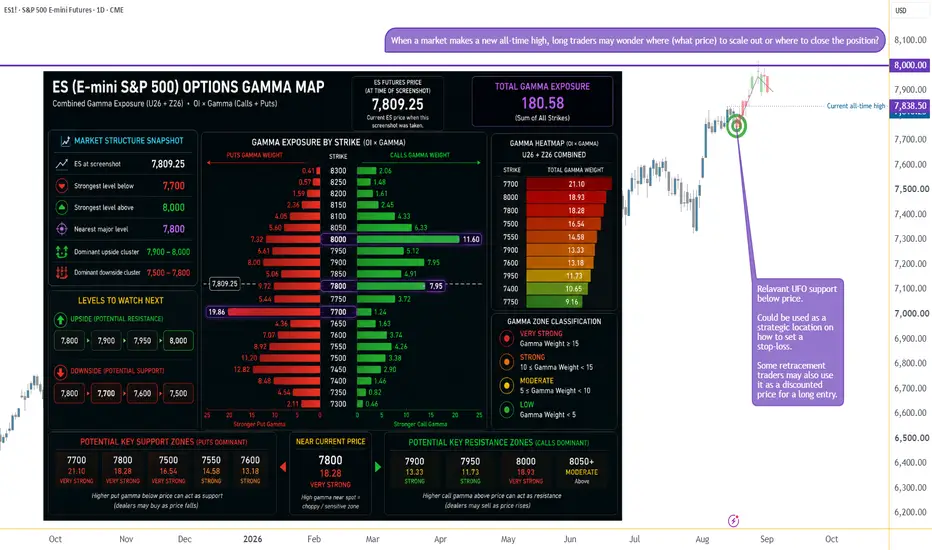
All-Time High: Finding Hidden Price Levels with Options Gamma1. What Happens When the Chart Runs Out of Resistance?
Price approaching an all-time high creates an unusual analytical problem.
Most traditional support and resistance techniques depend, at least partly, on historical price action. Previous highs, congestion areas, rejected levels and prior turning points give traders reference points around which to organize a market thesis.
But what happens when price moves into territory it has never visited before?
There may be no previous swing high a
AVGO GEX - Negative GEX Below HVLAVGO has broken down from a multi-week sideways range on the daily chart and is now trading below HVL at 407.5 , inside a negative GEX regime .
If the decline does not slow, the next structural target is 380 – P1 . Overhead, 440 – C1 remains the highest call wall, well above this breakdown. Price has already lost the 400 Ab1 cluster.
🔶 Regime Context 🔶
Below HVL, AVGO sits in a more reactive GEX regime. A reclaim of 407.5 would be the first sign of repair — until then, the structure s
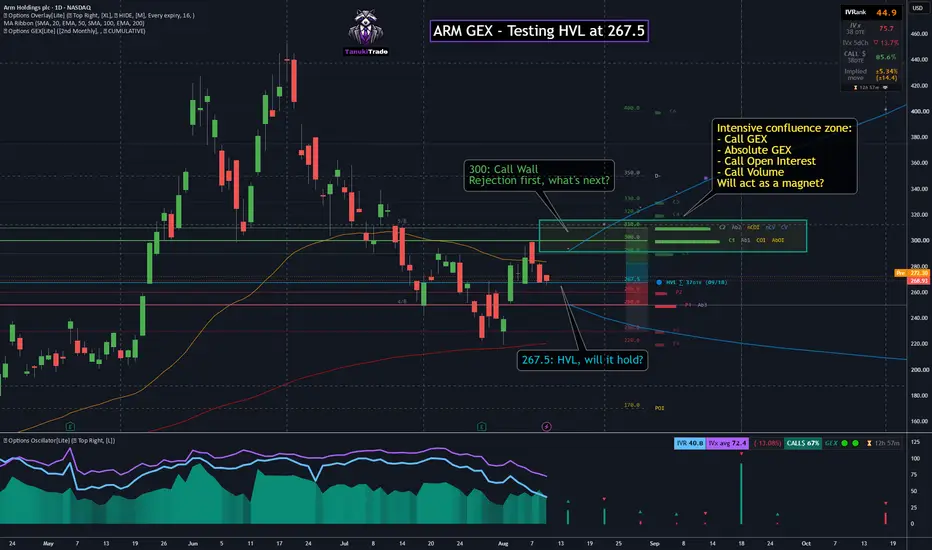
ARM GEX - Testing HVL at 267.5ARM just got rejected at 300 and is now sitting right on 267.5 HVL .
That’s the whole setup in one line: hold this pivot, and the big options cluster at 300 (C1 + Ab1 + COI + AbOI) can start looking like a magnet again. Lose it, and the next real put wall is 250 .
👉 267.5 — HVL, the line in the sand
👉 300 — call wall confluence (already rejected once)
👉 250 — strongest put wall if HVL fails
Skew is still call-heavy (CALL$ 85.6%), even with IVx cooling off. So the bias in options p
ORCL GEX - Testing 150 Call Wall, Squeeze Watch AboveORCL has pushed into 149.47 and is now pressed right against the Aug 14 call wall. Spot sits only a half-point under 150 , so this is no longer a distant overhead level — it is the active test.
🔶 Regime Context 🔶
Price remains well above HVL at 117 , so ORCL stays inside a positive GEX regime. The structural story is not the flip anymore. It is whether the 150 inventory cluster rejects — or gives way.
🔶 Options Structure Context 🔶
👉 150 – C1 (highest call NETGEX wall)
Confluence at 150:
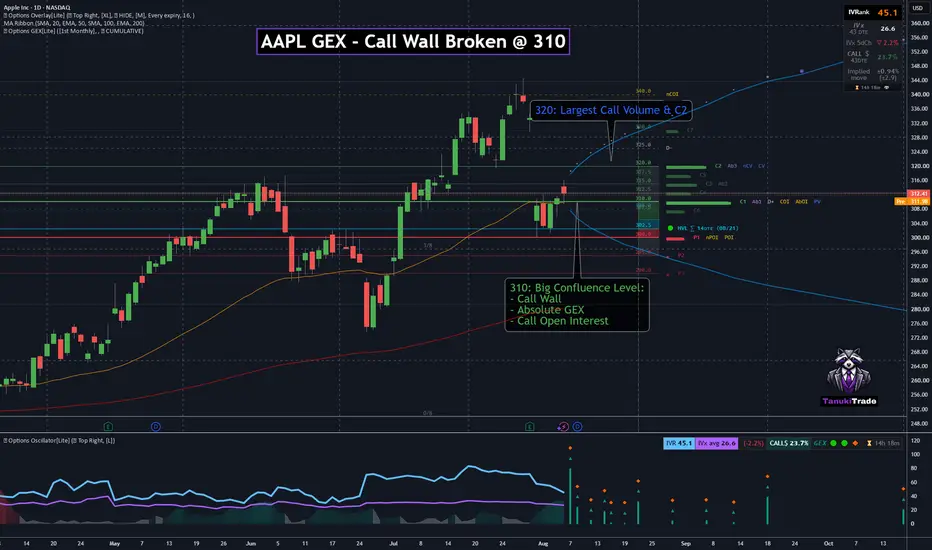
AAPL GEX - Call Wall Broken @ 310AAPL cleared a multi-week base under 310 and is now holding above that strike on the daily chart. For the 08/21 expiry (14 DTE, single), 310 is the C1 call wall — and it stacks with Ab1 and D+, so the breakout is through a real multi-metric reaction zone, not just a round number.
With C1 cleared, price has entered the positive extension zone — gamma squeeze potential opens toward the next call wall if acceptance holds above 310.
🔶 Regime Context 🔶
Spot is trading well above HVL at 300, keeping
SPX GEX - Call Wall Hit at 7750SPX has pushed into the 7750 call wall on the daily chart after a sharp, short-term stretch — price is trading well above the 50 SMA, with the advance looking overextended into the highest call NETGEX.
Spot sits near 7760.5, right at C1, while the largest absolute gamma ( Ab1 ) is parked just underneath at 7700 . That leaves the market pressing resistance with the heaviest absolute GEX still below price.
🔶 Regime Context 🔶
Price remains well above HVL near 7530 , so SPX is still inside a p
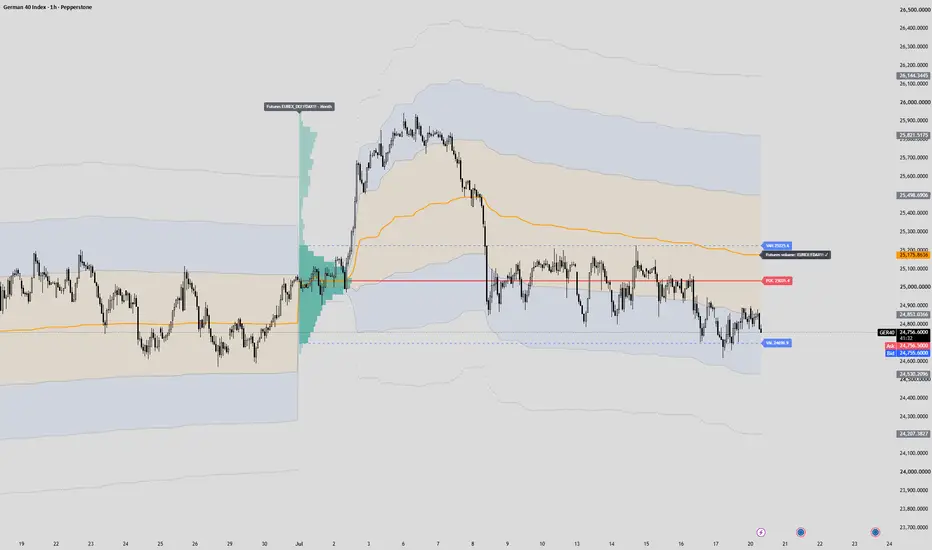
DAX W30 - four references inside 50 pointsTHE FRAME
The week closed at 24,842.1. Below July's point of control, below the first standard deviation of the monthly VWAP, bottom third of the value area.
Volume for all of this comes from the FDAX contract, not from CFD tick counts, and gets mapped onto the price of the chart it is drawn on.
Value area high 25,225.6 Point of control 25,035.4 Value area low 24,698.9 Monthly VWAP 25,176.2 VWAP -1 sigma 24,853.4 Friday's close 24,842.1
WHERE THINGS STACK
Four references sit overhead in