Long
Long
GBPUSD| Obective Reached, Structure ResetsHigher time frame bullish structure remains intact, and today’s objective has now been reached.
The lower time frame high has been breached, with take profit successfully achieved. From here, I’m stepping back to reassess the charts, map fresh structure, and identify the next liquidity objective before considering any new positions.
For now, I’m continuing to follow the bulls’ footprints and letting price reveal the next auction.
I’ll be posting a full video breakdown later tonight, covering the higher time frame narrative, lower time frame execution, and why I stayed confident through the pullback instead of reacting emotionally.
One reminder from today’s trade:
“The market does not beat them. They beat themselves.” — Jesse Livermore
When you’re in a quality trade, price often tests your conviction before rewarding your patience. My confidence came from top-down analysis and confirmed market structure—not from hoping.
Patience is key. Structure remains the edge.
Blessed trading. See you all tonight for the full breakdown.
ONDO: Will This Water-Leak Business 100x Your Investment?SYMBOL: LSE-ONDO | DIRECTION: LONG | TIMEFRAME: Weekly
Published: July 2026
Right.
A small cap InsurTech company trading at fifty four percent below its fifty-two-week high. The chart looks like someone dropped it down a flight of stairs. Volume is collapsing on the way down, the moving averages are flat, and the momentum oscillators are basically asleep. That is extraordinary. In a bad way. Obviously.
And yet.
The fundamentals tell a completely different story. Ondo is not a speculative consumer gadget company. It is a B2B2C infrastructure play solving the single most expensive, most frequent, most preventable claim in home insurance. Water damage. Thirty percent of all claims. Seventeen billion dollars annually across the US and UK alone. Their LeakBot device reduces those claims by seventy percent. For insurers, deploying a fifty to one hundred dollar sensor to prevent a ten thousand dollar claim is not a decision, it is an obligation.
The company has already moved past pilot phase. Nationwide has rolled out to twenty six US states. Indiana Farm Bureau is live. Westfield is live. The infrastructure is moving from "proof of concept" to "global scale-up" right now. That is the inflection point the chart is about to recognise.
Bear with me.
On the above 3 day (Weekly below) chart Ondo USD has formed a hammer pattern on the most recent close, with volume contracting sharply into a four-month low and three separate RSI oversold signals visible in the oscillator panel below. Four reasons now exist to expect a sustained recovery from these levels. They include:
1.Seller exhaustion and volume collapse
The downtrend has compressed volume to its lowest point in four months. Down moves are happening on declining volume, which is the technical signature of a market running out of sellers. The hammer candlestick on the current weekly bar, combined with the bullish divergence oscillator on oversold signals suggests capitulation is near or already complete. When the weakest hands exit, the next move tends to surprise them.
2. B2B2C Recurring revenue model creates predictable margin expansion
Unlike consumer hardware companies, Ondo does not depend on retail unit sales. Insurance carriers buy devices in bulk and distribute them free to policyholders. Every device becomes a multi-year software in service revenue stream. Once deployed, that recurring subscription revenue falls nearly straight to the bottom line. As US rollouts accelerate across twenty six states and other carriers follow, gross margins will expand dramatically, and the chart will eventually reflect that operational leverage.
3. Climate tailwind and Insurer desperation
Home insurance premiums are skyrocketing globally as climate-related disasters spike. Insurers are under extreme pressure to lower loss ratios. Water damage prevention is the lowest hanging fruit available to them. Ondo's LeakBot directly addresses this pain. The regulatory and environmental tailwind is real and durable. No competitor has a patented, self-install thermistor-based device at scale in the market today.
4. One caveat worth acknowledging: Early-Stage execution risk and US market adoption uncertainty
Ondo remains a small cap. Really small.. but that’s why it’s exciting. Rollouts across new US states are not guaranteed to accelerate at the pace management projects. If major carriers pause expansion, defer purchasing decisions, or encounter unforeseen technical or regulatory obstacles, the recurring revenue thesis will stall. The chart has already punished the stock heavily, but a breakdown below current support at 4.5 GBP would signal that the fundamental narrative is failing to convert into actual revenue traction. Watch quarterly results closely for deployment numbers and SaaS subscriber growth. The chart is currently betting those numbers arrive. If they do not, the recovery will fail.
Targets
Well leave that for elsewhere.
The crowd
The consensus on small cap InsurTechs is split between two camps, both wrong. One camp sees a hardware company that will struggle with retail friction and margin compression. The other sees unproven software and gets spooked by early losses. Neither understands that Ondo is not selling to consumers. It is selling to multinational insurers who have already done the ROI math and are now deploying at scale. The carriers are not moving because they like the environmental story. They are moving because every fifty dollar device prevents a ten thousand dollar loss. That economics does not change.
The chart has been punished because the market hates small cap and hates anything that looks like it got ahead of itself in 2024. But as US quarterly results begin to show actual SaaS subscriber growth and deployment acceleration, institutional capital tasked with ESG mandates will have to rotate into this name. The asymmetric payoff is clear. The only question is whether management can execute.
Why would you short a company solving the most expensive claim in an industry that cannot afford not to prevent it?
Good luck.
Ww
Type: LONG | Timeframe: Weekly
Weekly chart
==================================================
Disclaimer
This idea is for educational and informational purposes only. It is not financial advice. Small cap assets involve extreme volatility and risk of total loss. Always do your own research and consult a qualified financial adviser before making any investment decisions. Past performance is not indicative of future results.  Long
Long
 Short
Short
XAU/USD 15 July 2026 Intraday AnalysisH4 Analysis:
-> Swing: Bullish.
-> Internal: Bearish.
Bias and analysis to remain the same as analysis dated 30 June 2026.
Price did not print bullish CHoCH to indicate bullish pullback phase initiation. Price instead printed a new low followed by a bullish CHoCH
Price is currently trading within and established internal range, however, I will continue to monitor price with respect to depth of pullback.
Intraday expectation:
Price to trade up to either premium of internal 50% EQ, or H4 demand zone before targeting weak internal low, currently priced at 3,942.100.
Note:
Gold remains volatile as tensions between the US, Israel, and Iran keep safe‑haven demand elevated.
Markets are reacting quickly to every headline, while uncertainty around the Fed’s easing path and shifting U.S. policy under President Trump, especially tariffs continues to fuel choppy price action.
For newer traders, the key is simple, stay flexible and manage risk carefully, as fast spikes and sudden reversals are a normal part of the current XAU/USD environment.
H4 Chart:
M15 Analysis:
-> Swing: Bearish.
-> Internal: Bearish.
Bias and Analysis to remain the same as analysis dated 14 July 2026.
Price has printed according to analysis dated 14 July 2026 where I mentioned in alternative scenario that due to H4 internal structure being bearish, price could potentially target strong internal low and print a bearish iBOS.
Price subsequently printed a bearish iBOS and bullish CHoCH to indicate bullish pullback phase initiation.
Price is currently trading within a established internal range, however, I shall monitor price action with regards to depth of pullback.
Intraday expectation:
Price to trade up to either premium of internal 50% EQ, or M15 demand zone before targeting weak internal low, priced at 3,983.545.
Note:
Gold remains highly reactive on M15 as geopolitical risk continues to drive quick, headline‑led moves.
The tension between the US, Israel, and Iran is keeping safe‑haven demand elevated, with markets still sensitive to any sign of escalation.
At the same time, shifting US tariff policy under President Trump is adding extra uncertainty, fuelling sharp intraday swings and increasing the likelihood of sudden sentiment flips. Liquidity pockets and whipsaws remain common, making disciplined risk management essential.
Gold’s geopolitical premium is still firmly in place, and until tensions ease, short‑term volatility is likely to stay front‑loaded.
M15 Chart:  Long
Long
Long 
Across Protocol ACX - The RSI Didn’t Get the Memo - July 2026SYMBOL: COINBASE:ACXUSD | DIRECTION: LONG | TIMEFRAME: 4D
Published: July 2026
ACX is down ninety-seven percent from its high.
I wanted to mention that immediately, before anyone mistakes this for a chart about a thriving business rather than the financial equivalent of something found behind a radiator.
It is trading at four cents. There. Said it. We can all stop pretending this is dignified.
Now look at the RSI.
Price has been making lower lows for eighteen months. The RSI, meanwhile, has been making higher lows. The bears kept selling. The RSI carried on as though it had received a better offer.
That offer is bullish divergence, and it is without wishing to become emotionally attached to an oscillator, quite pretty. Thirteen of eighteen oscillators agree with the RSI divergence, which is more agreement than you normally get from eighteen people about where to have lunch.
Price has also confirmed on legacy support at $0.0328.
So we have price structure, RSI divergence and oscillator confirmation all saying broadly the same thing. Independent signals in agreement. Suspicious, frankly.
On the above 4D chart ACX has confirmed a hidden bullish divergence at legacy support. Two observations, they include:
1) RSI breakout from descending channel. For eighteen months RSI made lower highs
as price made lower lows. Then RSI higher lows began while price kept falling. RSI has now broken out of its descending channel resistance. The selling pressure is exhausting itself. The chart is telling you something that price has not yet agreed to say out loud.
2) Legacy support confirmed. The 1.0 Fibonacci level at $0.0328 is a long-standing
support and resistance level. Price reached it, tested it, and bounced. Confirmation of
support on prior resistance. The MA Forecast has flattened. Floors earned through a ninety-seven percent decline tend to matter when they hold.
Targets
1st: $0.6842 (+1,703%)
2nd: $0.9052 (+2,253%)
3rd: $1.1198 (+3,172%)
4th: $1.7796 (+4,820%)
No, I have not accidentally leaned on the keyboard.
Percentage gains become rather theatrical when the starting price is four cents. That is mathematics, not optimism although, admittedly, the distinction becomes harder to see after target three.
The crowd
Nobody is looking at crypto in general, they have checked out. ACX is at four cents after falling ninety-seven percent. People stop looking at things after falls like that. Completely understandable. It is also, historically, roughly the point at which the interesting signals start appearing.
Am I saying ACX goes to $1.78? The chart says it has been there before. The RSI says the
divergence is confirmed. The oscillator says Incredible Buy. I am not saying anything the
indicators are not already saying first. I am just the one willing to post it.
Is it possible price action keeps correcting after -97%? Sure. Those are the same sellers with a copy of "How to trade like Micheal Saylor" on the bookshelf.
Is it probable? No.
Ww
Type: Speculative long / crypto | Timeframe: 6-18 months
===============================================
Disclaimer : This idea is for educational and informational purposes only. It is not financial advice. Crypto assets carry extreme risk and significant volatility. Capital loss up to and including 100% is possible. Always do your own research and consult a qualified financial adviser before making any investment decisions. Past performance is not indicative
of future results.  Long
Long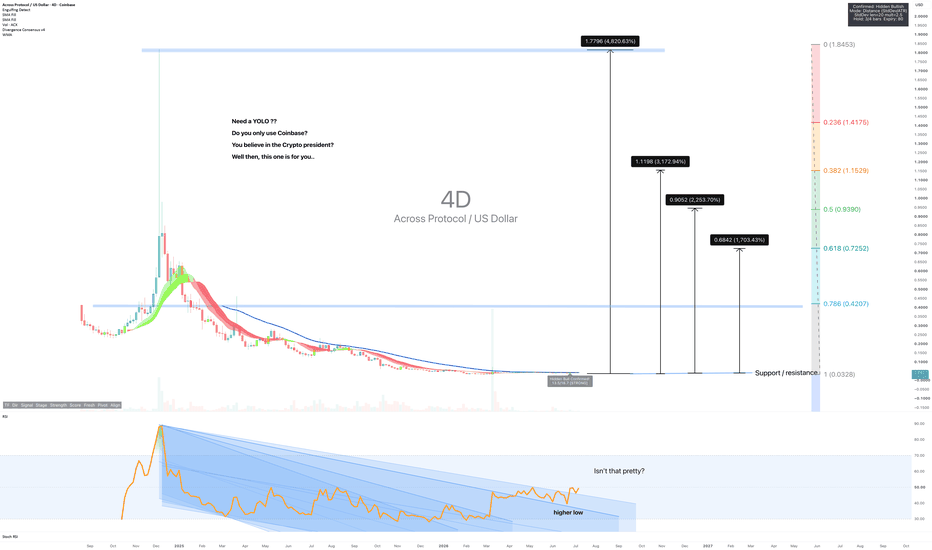
Two Valid Scenarios Remain | Elliott Wave AnalysisBitcoin (BTC/USD): Two Valid Scenarios Remain | Elliott Wave Analysis
In this analysis, both the conservative and aggressive scenarios remain valid. Until the market completes its structure, neither scenario has a decisive advantage over the other.
Under the conservative scenario, there is a possibility that the larger-degree Wave (IV) has already been completed, and the market is now developing Wave (1) of Wave (V). If this wave count is correct, the current correction may complete Wave (2) as a Double Zigzag, allowing the market to resume what could become the largest impulsive phase of Wave (V).
From this perspective, price action is the key factor. If the market begins to develop a strong Impulse or even a series of Nested 1-2, 1-2, 1-2 formations, it would significantly strengthen the probability that a new impulsive advance has already begun.
On the other hand, the aggressive scenario still suggests that the recent decline was only the first stage of a much larger corrective structure. In this case, the current rally may simply be another corrective phase, whether as a Simple Zigzag, Double Zigzag, Triple Zigzag, or any other valid corrective pattern. Once that structure is complete, another decline would be expected.
If this scenario unfolds, the larger corrective targets remain in the $30,000–$40,000 region. Furthermore, if the market is still developing the larger-degree Wave (IV), a deeper correction toward the Wave (4) of Wave (5) region, near $15,000, cannot be ruled out and remains a valid structural possibility.
At this stage, the most important question is not where price will ultimately trade, but whether the current advance marks the beginning of a new bullish trend or is simply a corrective rally before the next decline.
As with every Elliott Wave analysis, this is a structural interpretation of the market—not a price prediction. As long as the rules and guidelines of the Elliott Wave Principle continue to support these wave counts, both scenarios remain valid. Ultimately, the market itself will determine which structure unfolds.
We do not predict price—we follow the structure the market builds.
— Mr. Nobody
Independent Elliott Wave Principle Researcher
"Patterns whisper. I listen." 📊🎧
Bitcoin
Jun 2
BTCUSD 4H | The Geometry of Patience: Price, Time & the Triple Z
Bitcoin
May 22
BTCUSD — The Macro Structural Cycle (2026–2030)
Bitcoin Futures
6 days ago
Wave (IV) May Be Preparing the Next Bullish Cycle
Bitcoin
5 days ago
Bitcoin (BTC/USD): Simple Zigzag Remains the Preferred Structure
 Long
Long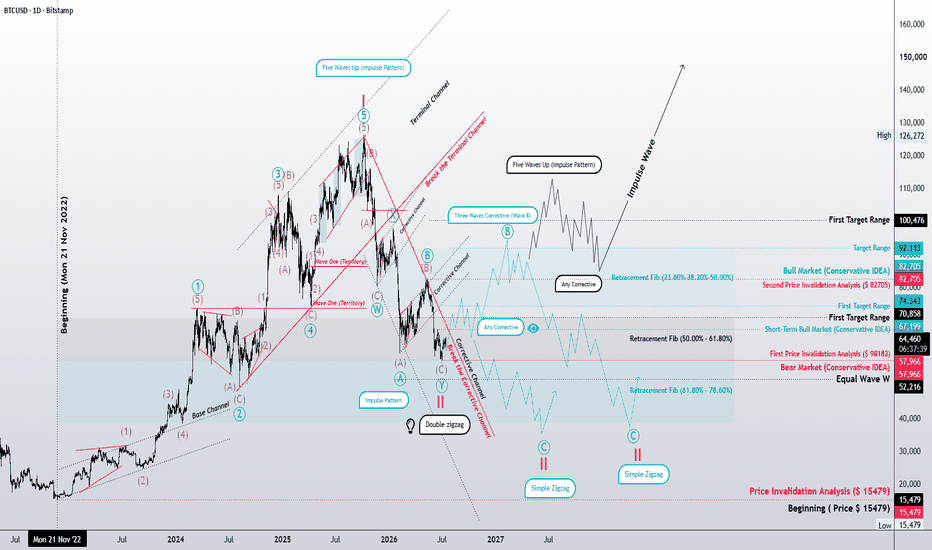
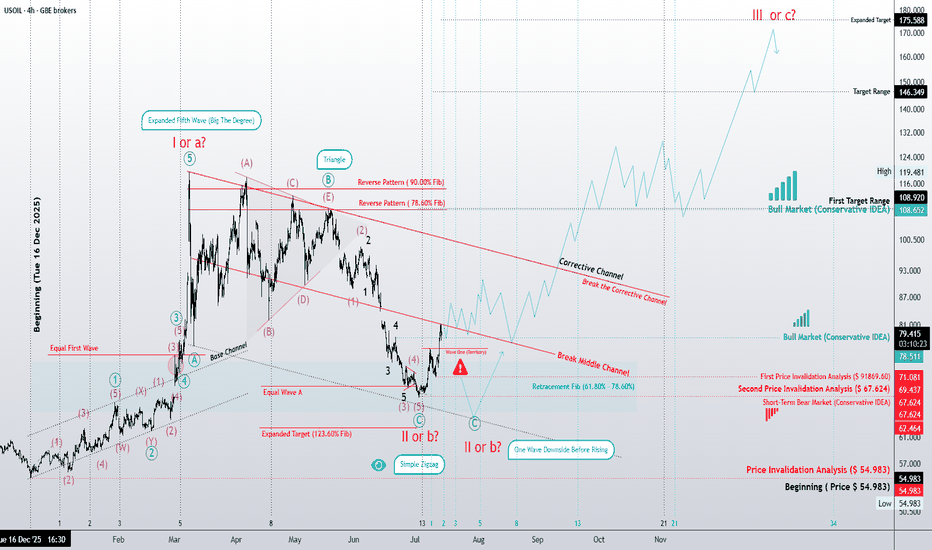
Impulse, Diagonal, or a Larger Correction?Crude Oil (USOIL)Crude Oil (USOIL) – 4H Elliott Wave Update
Impulse, Diagonal, or a Larger Correction?
The recent decline may have completed either Wave II of a developing bullish cycle or Wave b within a larger corrective structure. At this stage, both interpretations remain valid, and the market has not yet provided enough structural evidence to confirm either scenario.
If the bullish count is correct, the next advance could unfold in more than one form.
The most straightforward scenario is a classic five-wave Impulse. However, Elliott Wave Principle also allows another possibility that deserves careful attention: Wave III itself may develop as a Diagonal.
Depending on how the structure evolves, this diagonal could appear as:
A Leading Diagonal, particularly if it marks the beginning of a larger fifth wave.
An Ending Diagonal if the market gradually loses momentum.
An Extended Ending Diagonal.
A Contracting Ending Diagonal, which currently appears to be the more probable diagonal variation.
In each of these diagonal structures, the internal subdivision would follow the familiar 3-3-3-3-3 sequence rather than the traditional impulsive subdivision.
On the other hand, if geopolitical conditions, supply disruptions, or market psychology suddenly intensify, the advance may instead develop into a powerful classic Impulse, producing a much stronger acceleration than a diagonal would normally suggest.
The projected path shown on this chart represents only a schematic illustration of a possible bullish sequence. It should not be interpreted as the exact path price must follow. As the structure develops, each wave may become more complex and subdivide into additional internal degrees.
For now, the primary objective is much simpler.
The market should first reach the initial target zone and successfully break above the previous Wave B, currently labeled as Wave III on this count. Only after that structural confirmation will higher Fibonacci objectives become increasingly reliable.
Alternative Corrective Interpretation
Another possibility is that the correction is not developing as a Zigzag at all.
Instead, it may be forming a Flat Correction—possibly even an Expanded Flat.
One reason this scenario deserves consideration is that Wave A retraced nearly 90%, behavior that remains consistent with several Flat variations. Although the structure currently appears somewhat irregular, Elliott Wave guidelines recognize that Flats can often develop with a relatively "messy" internal appearance.
If this interpretation proves correct, the equality relationships between corrective waves may become more reliable than extended Fibonacci projections during the early stages of the new advance. Until the market clearly reveals the character of the next motive structure, these proportional relationships deserve close attention.
The Conservative Scenario Remains on the Table
Despite the increasing probability of a bullish reversal, the conservative scenario shared in my previous long-term analysis remains completely valid.
Under that interpretation, the entire decline may still represent only Wave (II) of a larger degree, unfolding as a Classic Zigzag before the next long-term bullish cycle begins.
For those interested in the broader context, I encourage reviewing my previous long-term Crude Oil analysis, where this conservative roadmap is discussed in greater detail.
Final Thoughts
At this stage, the objective is not to predict the exact path of the market.
It is to recognize the structures that remain valid, identify the levels that confirm or invalidate each scenario, and allow price action to reveal the true character of the developing trend.
Sometimes the market advances through a clean Impulse.
Sometimes it progresses through a slow and overlapping Diagonal.
The difference is not only in price—it is in the character of the wave.
Patterns whisper. I listen.
— Mr. Nobody  Long
Long