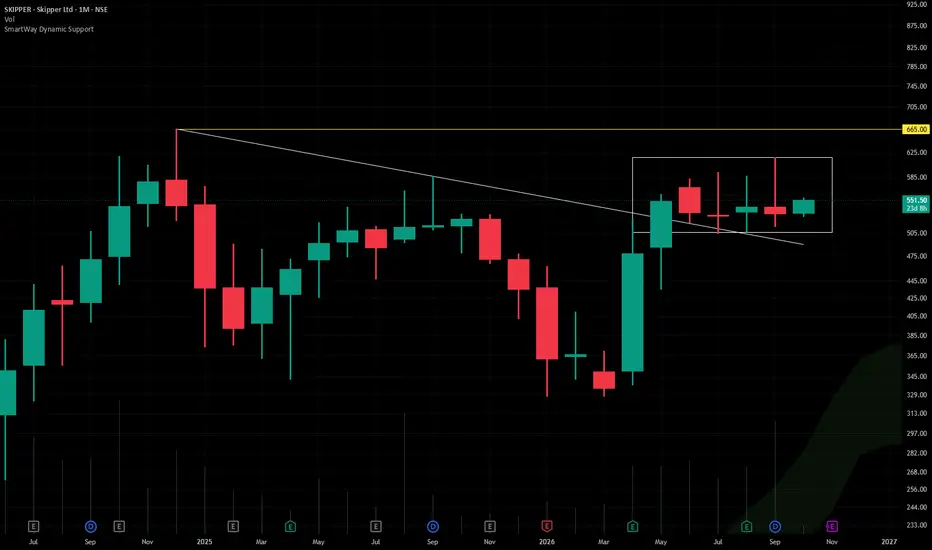
SKIPPERSkipper Ltd. (CMP โน552.00, NSE: SKIPPER)
The SmartWay Research Desk | 7 October 2026
A Kolkataโbased infrastructure and engineering company, incorporated in 1981. Skipper Ltd. is one of India's leading manufacturers of power transmission towers, telecom towers, railway electrification structures, PVC pipes, and polymer products. The company serves major utilities, infrastructure developers, and government projects across India and exports to multiple countries.
Promoter Holding (Jun 2026)
Rectangle
MESZ Oct 6: Bullish Breakout Confirmed โ 7881 Next?MESZ has confirmed the higher-time-frame breakout after a 4-hour candle closed above 7,815.
Price is now trading around 7,863, and the first upside liquidity target sits around 7,880โ7,881.
Below current price, the green fair value gap remains an important support and reaction zone. A pullback into that area would not automatically invalidate the bullish structure.
On the 15-minute chart, liquidity around 7,820 is also worth monitoring as a possible deeper pullback target during the week.
The ke
MESZ Oct 5: 7759 Pullback Before a Break Above 7815?MESZ starts the week after recovering from last weekโs liquidity sweep around 7,710.
The main higher-time-frame breakout level Iโm watching is 7,815.
A confirmed 4-hour close above 7,815 would strengthen the bullish structure and could support continuation toward approximately 7,848.
For today, the first important intraday level is the overnight liquidity around 7,759.
Price may revisit this area before deciding its next direction.
If buyers defend 7,759, Iโll continue watching for another push
Squeezed Below $86.5K and the Local Trendline โ Volatility AheadHello traders! ๐ด
During todayโs Asian ๐ฃ trading session, bulls managed to extend the move that had looked like nothing more than a dead cat bounce throughout the weekend, pushing Bitcoin all the way up to $86,996.
However, holding above the $86.5K level has once again proven to be very difficult ๐ช๐ช๐ช
Iโve repeatedly highlighted that โBitcoin has already made several attempts to break through the $86.5K zone on September 21, 22 and 23, but none of them succeeded.โ
We can now add October 2 an
USDJPY: Bullish Outlook Explained ๐บ๐ธ๐ฏ๐ต
USDJPY will likely continue rising after a retest of the recently broken resistance of a consolidation range on a 4H time frame.
The formation of a buying imbalance candle indicates strong bullish pressure.
Goal - 158.64
โค๏ธPlease, support my work with like, thank you!โค๏ธ
I am part of Trade Nation's Influencer program and receive a monthly fee for using their TradingView charts in my analysis.
EURUSD to continue falling??Breakout of the 1.1324 was a very important event, price gave breakout below a sideways consolidation of around 1.5 years, not this is not a random move, we need to give due respect to the breakout and, looking at the momentum it seem to be continuing for the up coming week as well.
Next support could be seen at 1.1080
Our biasness remain on bearish direction, on every pull back, try to spot rejection point and take shorts with appropriate risk management accuracy would be really high, don't tr
BTC: $86.5K False Breakout โ Back to $82.5Kโ$85K RangeHey traders! ๐ด
I donโt usually make posts on weekends, but Fridayโs price action was too interesting not to comment on. ๐คก
First of all, price once again failed to establish a solid acceptance above $86.5K ๐ช๐ชโฐ๏ธ
Yesterday, when we broke above this level, I wrote:
โKeep in mind that Bitcoin already made several attempts to break through the $86.5K zone on September 21, 22 and 23, but none of them succeeded.โ
Second, we came just $150 short of the local high at $87.4K โ which would have most l
BTC: $86.5K Breakout โ Clear Air to $90KHey traders!๐ดโ๐ผ
In my post on September 28, I pointed out that:
โBTC is getting squeezed into a tight $82.5Kโ$85K range โ things could get very volatile.โ
Between September 28 and 30, price continued to squeeze inside that range. Then, on the pre-market on September 30 โ BOOM ๐ฅ A single hourly candle pushed BTC from $83.7K to $85.7K, followed by a sharp move back down to $83.3K over the next two hours.
That was exactly the kind of volatility I was warning about.
Whatโs happening on the cha
ASTER: Volume Picks Up, Watching for a Break Above $0.78BINANCE:ASTERUSDT stays on my watchlist for now. Daily trading volume has picked up compared with the summer consolidation, but price remains inside the triangle. Higher volume alone does not confirm the breakout direction.
I would consider a long only after a confirmed break above $0.78โ$0.782 : a daily close above the zone, ideally followed by a successful retest.
My take-profit area is around $0.90, ahead of the broader resistance zone near $0.91โ$0.98. That offers roughly 15% upside fr
MESZ Oct 1: 7767 Breakout or 7705 Breakdown?MESZ swept overnight liquidity around 7,705 and is now trading back near the middle of the current range.
For the upside, 7,767 is the main confirmation level.
A confirmed 1-hour or 4-hour close above 7,767 could support continuation toward 7,786, followed by the higher liquidity area around 7,814โ7,840.
On the downside, 7,705 remains the key support and bearish confirmation level.
A confirmed break below 7,705 could open the path toward approximately 7,675.
Key levels
- 7,767 โ bullish confirma
[FOREX] CADJPY - 1D Timeframe Analysis - Short setup CADJPY - 1D Timeframe Analysis
Trade on lower Timeframe once the bearish indication completes
After the Distribution phase in rectangular box,
it appears a declining phase, inverted cup & handle pattern
Entry should be through Sell stop when the inverted cup and
handle neckline breaks at marked LL, R:R = 1:3
(I am currently in learning phase, manage your risk/reward
accordingly, it isn't a financial advise)
BTC Gets Squeezed Into a Tight $82.5Kโ$85K Range!Hello traders!๐ด
In the last post, I identified consolidation within the $84Kโ$86.5K range, with small false breakouts in both directions.
Unfortunately for ๐ฆฌ, after the false breakout of the $84K level on Thursday, price failed to convincingly reclaim and hold above this level on Friday and throughout the weekend. As a result, price made the exact โacceleration toward the $82.5K horizontal levelโ I warned about.
Today, price printed two local lows at $82,550 and $82,510 ๐ฏโ
Whatโs happening
Head & Shoulders in Gold before US CPIStory
Gold is testing the neckline of a head-and-shoulders top just hours before Friday's US CPI report.
A stronger-than-expected August jobs report has already pushed the odds of a Federal Reserve rate hike next week above 70%, a day after the European Central Bank delivered a hike of its own. A hot inflation print could tip gold through the neckline, though the volatility it brings may tempt bullish traders to buy the dip soon after.
Technicals
Gold's chart is telling the same story as th
KRDI - preparing for a big move KRDI - timeframe 30m
simply
higher low - breakout last high = uptrend but short term
entry around 0.455
stop loss 0.446
min target 0.476
note: closing over 0.44 on a monthly basis turn the stock from side way range to uptrend for long term
Disclaimer: This is not investment advice, only my analysis based on chart data.
Consult your account manager before making any investments.
Thank you, and good luck.
NZDCAD: More to The Upside ๐ณ๐ฟ๐จ๐ฆ
NZDCAD may rise even further after the yesteday's pullback.
I see a confirmed breakout of a resistance line of a horizontal range on a 4H.
Expect a bullish continuation to 0.8038
โค๏ธPlease, support my work with like, thank you!โค๏ธ
I am part of Trade Nation's Influencer program and receive a monthly fee for using their TradingView charts in my analysis.
Building a Base Around $84Kโ$86.5KHey traders!๐ป๐ฆฌโ๐ผ
In my last post, I particularly highlighted the parabolic structure we were seeing during the move from $81K to $87.4K, specifically:
โIt is very important to understand that such a parabolic move is not technically healthy and is extremely difficult to predict. From a technical perspective, I would actually prefer to see either a small correction toward $84K, into the ascending trendline (green circle on the chart), or several days of consolidation around current levels.
Tha
Solanaโs Token Supercycle Gains MomentumSolanaโs blockchain is at the forefront of the emerging token supercycle, as highlighted by a recent tweet from the official Solana handle. The tweet noted that builders will convene in London this November to discuss innovations and developments within the ecosystem. This meetup could have significant implications for Solanaโs future and its position in the broader crypto market, as it seeks to capitalize on the momentum of digital assets and tokenized projects.
What Happened
The broader crypt
Bitcoin: Parabolic Acceleration or Building a Base?Hello traders! ๐ดโ๏ธ
Timing is everything)
Yesterday at 01:15 NY time, just two hours before Bitcoin exploded from $81K to $87,397, I published a post warning you that the technical picture was looking very bullish ๐ฆฌ๐
โYes, we have not reached the projected target of $82.5K yet, but we have already printed a local high at $81,087, established a new trading range above $80K, reacted strongly from the newly formed ascending trendline, and continue to pressure the $82K level from below.
All of th
CYRX - 4 months RECTANGLEโโโโโโโโโโโโโโโโโโโโโโโโโโโโโโ
Since 2014, my markets approach is to spot
trading opportunities based solely on the
development of
CLASSICAL CHART PATTERNS
๐คLetโs learn and grow together ๐ค
โโโโโโโโโโโโโโโโโโโโโโโโโโโโโโ
Hello Traders โ
After a careful consideration I came to the conclusion that:
- it is crucial to be quick in alerting you with all the opportunities I spot and often I don't post a good pattern because I don't have the opportunity to write down a proper didactical comment;
- sin