SPY Is Holding Above The 771.43 Ceiling It Broke.SPY Is Holding Above The 771.43 Ceiling It Broke.
SPY is trading at 773.89, a second session above the level that rejected it repeatedly for two weeks, with 775.30 as the overnight high. The two timeframes do not agree: the 4H reads low-conviction long with a Q1 surface, a live CQI in the top quartile and volume at the 98th percentile, while the hourly reads Q4 short with a swept high behind it and nothing at all on the timing layer. That is price leading conviction rather than conviction confirming price, the same shape the breakout itself had. The monthly jobs report lands before the open, and structure cannot price a scheduled release. Neutral.
Resistance: 775.30 - the overnight high
Key resistance: 779.37 - the swing high above 777.62
Current price: 773.89
Support: 771.43 - the broken ceiling, now the line that has to hold
Key support: 765.52 - the old range floor
Structural floor: 759.13 - the flush low from earlier this week
Two paths from here:
It holds 771.43 and the breakout becomes structure. A decisive close above 775.30 opens 777.62 and then the 779.37 high, and each session that closes above the old ceiling turns it from a poke into a floor. For that to be more than drift the hourly surface has to firm with price instead of fading against it.
It loses 771.43 and the break was a poke. A close back below the reclaimed level puts 765.52 in play as the range floor again and resets the whole two-day round trip to chop. Below 765.52 the 759.13 low is the next reference.
The level that governed the last two weeks is now underneath price instead of above it, and today's release is what tests it. 771.43 holds and this is a breakout; 771.43 fails and it was a visit.
Built with SYNTHESIS v3.3 | SOM / ACE / IMP / SYNTHESIS
Study, not financial advice. NVDA Tagged A New High At 232.48 And Is Holding 231.NVDA Tagged A New High At 232.48 And Is Holding 231.
NVDA printed a new high at 232.48 overnight and has eased back to 231.05, which completes the repair that started at the 217.73 shelf and carries it past last session's high. Conviction is not following the price: the hourly light is red on a neutral quartile with a zero score, the 4H sits neutral in Q3, and the timing layer reads zero of five with neither participation nor extension on either timeframe. Anti-signals are clear and the 4H structure is still bull, so this is an orderly push rather than a stretched one, but a new high made on a flat surface is a level to respect rather than chase. Neutral.
Resistance: 232.48 - the overnight high
Key resistance: 236.43 - the next zone above, untested
Current price: 231.05
Support: 229.14 - the shelf directly under price
Key support: 227.11 - then 226.52, the levels it cleared on the way up
Structural floor: 222.43 - deeper support
Two paths from here:
It clears 232.48 and the move extends. A hold above the overnight high leaves clean air toward the 236.43 zone with no structure between the two. That is the path that needs the conviction surface to catch up, because right now price is doing the work alone.
It loses 229.14 and the push gets digested. A close below the shelf points back at 227.11 and 226.52, and 222.43 sits under those as the deeper test. Below 229.14 the new high becomes the failed part of the move rather than the start of the next one.
The repair off 217.73 is finished, so the question is no longer whether the breakdown healed. It is whether 232.48 becomes a floor or a ceiling, and 229.14 is where that answer starts.
Built with SYNTHESIS v3.3 | SOM / ACE / IMP / SYNTHESIS
Study, not financial advice. BTC Is Coiling At 81,300 Under The 82,283 High.BTC Is Coiling At 81,300 Under The 82,283 High.
BTC is at 81,317 after a five percent session, sitting just below the 82,283 high without having retested it yet. The 4H reads low-conviction long with a Q1 surface and a live CQI in the top quartile, but the same panel shows extension mode with range expansion active and the extension percentile at the 84th, and the reversal state reads EUPHORIA with the short side scoring two of three. The hourly is neutral, no participation, no anti-signal. Price near a high, extension elevated, euphoria present and the timeframes not agreeing is a combination to respect rather than chase. Neutral.
Resistance: 82,283 - the high, not yet retested
Key resistance: 86,140 - the next zone above
Current price: 81,317
Support: 79,318 - the shelf beneath price
Key support: 78,028 - the line it reclaimed on the way up
Structural floor: 74,182 - where the last pullback based
Two paths from here:
It takes 82,283 and the melt-up extends. A break that holds above the high leaves the 86,140 zone as the next real reference with nothing structural in between. The caveat is that a push into euphoria with extension already elevated is historically the setup that fades as often as it runs.
It fails at the high and works back down. Losing 79,318 puts 78,028 back in play, and below that 74,182 is where the last pullback found its base. A rejection here would make this a lower high against 82,283 rather than a pause under it.
The high is the whole question. Everything above 82,283 is untested, and everything below 79,318 starts giving back the move that got it here.
Built with SYNTHESIS v3.3 | SOM / ACE / IMP / SYNTHESIS
Study, not financial advice. BTCUSDT: Downward Channel Signals Further Potential DownsideHello everyone, here is my breakdown of the current BTCUSDT setup.
Market Analysis
BTCUSDT previously traded inside a wedge before breaking above the resistance line and shifting bullish. Price then formed a range before breaking higher toward the 79,200 Resistance Zone. The recent rejection from resistance has led to a new downward channel.
Currently, BTCUSDT is trading below the 79,200 Resistance Zone while moving lower inside the downward channel. Price is approaching the 75,000 Support Zone, making this area important for the next move.
My Scenario & Strategy
As long as BTCUSDT remains below the 79,200 Resistance Zone and respects the downward channel, the bearish scenario remains valid. A continuation lower could push price toward the 75,000 Support Zone (TP1).
However, a breakout and close above the 79,200 Resistance Zone would weaken the bearish outlook and increase the risk of further upside.
That’s the setup I’m tracking. Thank you for your attention, and always manage your risk.  Short
Short
HOW-TO: Understanding BUY, ADD, and EXIT Signals in Dynamic MomeDynamic Momentum Trend Signals (DMT Signals) is a systematic trend-following indicator designed primarily for medium- to long-term cryptocurrency market analysis.
Rather than attempting to predict exact market tops or bottoms, DMT Signals identifies changes in momentum and trend conditions after they are confirmed.
BUY — Initial Trend Entry
A BUY signal indicates that the conditions required for an initial bullish trend entry have been confirmed.
The purpose is not to identify the exact market bottom. Because the methodology requires confirmation, BUY signals may appear after an upward move has already begun.
ADD — Trend Continuation
An ADD signal indicates that an existing bullish trend has continued and additional momentum conditions have been satisfied.
Therefore, BUY and ADD represent different stages:
BUY → Initial bullish trend confirmation
ADD → Continuation of an established bullish trend
This allows trend development to be evaluated progressively rather than relying on a single entry signal.
EXIT — Bearish Momentum Confirmation
An EXIT signal indicates that bearish momentum conditions have been confirmed.
It is not designed to identify the exact market top. As with many trend-following approaches, part of an established move may be given back before sufficient evidence of trend deterioration appears.
Signal Confirmation
DMT Signals evaluates conditions using confirmed candle data. Signals are generated only after the relevant candle has been confirmed, and confirmed historical BUY, ADD, and EXIT signals are designed not to repaint.
This approach prioritizes confirmation and consistency over generating the earliest possible signal.
Market Conditions
DMT Signals is designed primarily for daily cryptocurrency charts. Trend-following methodologies generally perform best during sustained directional movements.
During sideways, choppy, or rapidly reversing markets, false signals and unsuccessful entries can occur.
A typical signal sequence can therefore be interpreted as:
BUY → bullish trend conditions confirmed
ADD → trend continuation conditions confirmed
EXIT → bearish momentum conditions confirmed
Not every market cycle will produce all three signals, and no individual signal guarantees a profitable trade.
DMT Signals is intended for analytical and educational purposes only and does not constitute financial or investment advice. Education 
 Long
Long
XAUUSD: Bulls Regain Control, but $4,500 Remains the Key TestGold has staged a strong recovery after the recent selloff, climbing back toward the $4,480 area following a gain of more than 2% on Thursday.
The short-term structure has improved significantly, but price is now approaching an important psychological and technical barrier around **$4,500**. This is the area I am watching for confirmation of whether the recovery can develop into a broader bullish continuation.
**Key levels**
Immediate resistance: **$4,490-$4,500**
Upside target: **$4,540**
Near-term support: **$4,440-$4,450**
Secondary support: **$4,380-$4,400**
As long as Gold holds above the $4,440-$4,450 region, buyers retain the short-term advantage. A sustained break and acceptance above $4,500 would strengthen the bullish structure and could open the way toward the $4,540 area.
However, rejection from $4,500 followed by a loss of $4,440 would suggest that the current move is still a recovery within the larger correction. In that scenario, $4,400 and then $4,380 would come back into focus.
Fundamentally, today's US employment report is the major catalyst. Gold rallied strongly on Thursday after Federal Reserve Governor Christopher Waller indicated that he could support keeping rates unchanged if inflation continues to moderate, reducing expectations for an immediate rate hike.
The Nonfarm Payrolls release could now significantly influence expectations for the Fed's September decision, so volatility around these technical levels may increase sharply after the data.
**Bias: cautiously bullish above $4,440, with $4,500 remaining the key confirmation level.**
Rather than chasing the recovery into resistance, I am watching how price reacts around $4,500 and whether buyers can defend the $4,440-$4,450 area on any pullback.
 Long
Long
 Long
Long
Short 
 Long
Long
XAUUSD — Bullish Setup From 4,425
Gold is building a bullish recovery structure after completing the previous bearish wave 5 near the lower demand zone. From Kelly’s view, the current chart suggests that XAUUSD may be preparing for another upside leg if buyers continue to defend the End wave C / Buy zone.
The key idea is simple: gold may correct slightly first, but as long as price holds above the buy zone, the bullish structure remains valid toward the upper liquidity area.
⟡ Market Structure
Gold reacted strongly from the 4,280–4,300 area, where the previous downside wave appears to have completed. After that, price created a new bullish impulse and is now consolidating around 4,472–4,488.
The most important support is the 4,420–4,430 Buy zone. This zone is marked as the potential end of wave C. If price pulls back into this area and buyers defend it, gold may start a new bullish wave.
The first confirmation area is around 4,488–4,500. A clean break above this zone would support stronger upside continuation toward 4,525–4,550, then the major liquidity target near 4,615–4,630.
➤ Key Levels
◌ Current price area: 4,472–4,488
◌ End wave C / Buy zone: 4,420–4,430
◌ Bullish confirmation: above 4,500
◌ First upside target: 4,525–4,550
◌ Main liquidity target: 4,615–4,630
◌ Bullish invalidation: below 4,400
⌁ Elliott Wave View
The chart shows that the previous bearish wave 5 may have already completed around 4,280–4,300.
From that low, gold is now forming a new recovery structure. The current pullback may be part of an ABC correction before the next bullish wave develops.
If wave C ends around 4,420–4,430, buyers may push price higher again. The next upside sequence can target 4,500, then 4,550, and finally the liquidity zone around 4,615–4,630.
This is why Kelly is not chasing buys at the current price. The cleaner plan is to wait for price to confirm support or break above the short-term liquidity level.
▸ Trading Scenario
Preferred bullish scenario
Entry: Buy around 4,420–4,430 if price gives bullish confirmation from the End wave C / Buy zone
Stop Loss: Below 4,400
Take Profit 1: 4,500
Take Profit 2: 4,525–4,550
Take Profit 3: 4,615–4,630
Alternative entry
If gold breaks and holds above 4,500, buyers may look for continuation toward 4,525–4,550 without waiting for a deeper pullback.
◌ Invalidation
The bullish view becomes weaker if gold breaks below 4,400 and fails to reclaim the buy zone. In that case, the recovery structure may need more correction before a new bullish setup appears.
⌁ Kelly’s View
Kelly’s main view is bullish while gold holds above 4,420–4,430. The market has already reacted strongly from the lower demand area, and the current movement looks more like a correction before continuation.
If buyers defend the buy zone and price breaks above 4,500, gold may continue toward 4,550 and the main liquidity zone near 4,615–4,630.
Do you think gold will retest the buy zone first, or break above 4,500 directly? Long 
XAUUSD 2H — Bullish Structure After Liquidity SweepMarket structure:
Price previously established a bullish sequence with multiple BOS confirmations.
The subsequent decline swept liquidity around the 4,300–4,320 area.
Price then reacted strongly from the lower 2H FVG / OB region.
A bullish MSS has now appeared around the 4,470–4,480 area.
The nearby Demand Zone around 4,430–4,445 is the key area to monitor for a potential retest.
Key levels from the chart:
MSS / structure: ~4,470–4,480
Demand zone: ~4,430–4,445
Lower 2H FVG + OB: ~4,310–4,340
Major lower FVG: ~4,280–4,295
Upside reference areas: ~4,560 and ~4,680
Possible scenario
If price holds the demand zone and maintains the bullish structure, continuation toward the higher resistance/liquidity areas could become technically relevant.
If price instead breaks and closes below the demand zone, the bullish continuation thesis becomes weaker and price could revisit the lower imbalance/OB areas.
TradingView-ready description
XAUUSD 2H — Market Structure & Demand Retest
Gold has shifted back toward a bullish structure after reacting from the lower 2H imbalance area. The recent bullish MSS near 4,470–4,480 suggests a potential change in short-term structure.
The 4,430–4,445 region is the main demand area to monitor. A sustained reaction from this zone could support continuation toward higher liquidity/resistance areas around 4,560 and potentially 4,680.
A decisive move below the demand zone would weaken this scenario and bring the lower 2H FVG/OB area back into focus.
This is technical market analysis for educational purposes, not financial advice. Price can invalidate the scenario at any time. Long 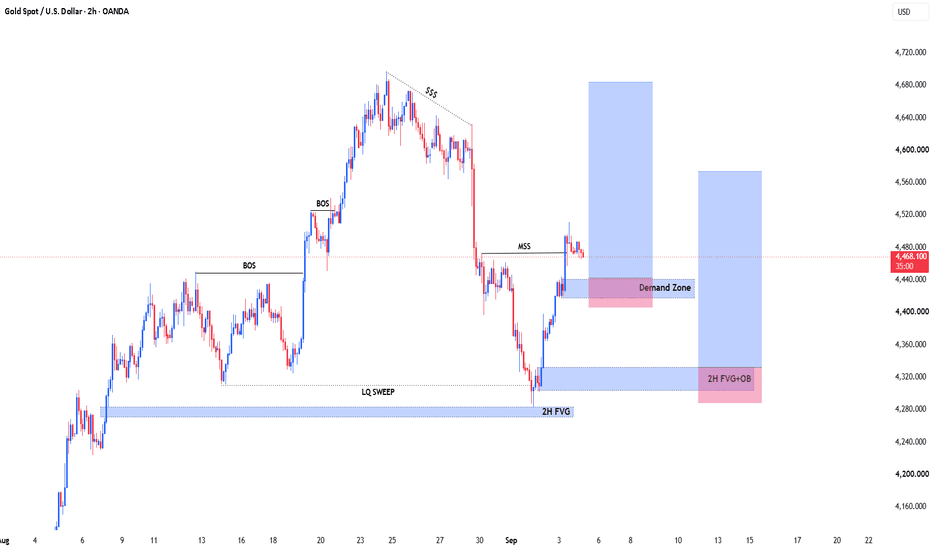
 Short
Short
 Short
Short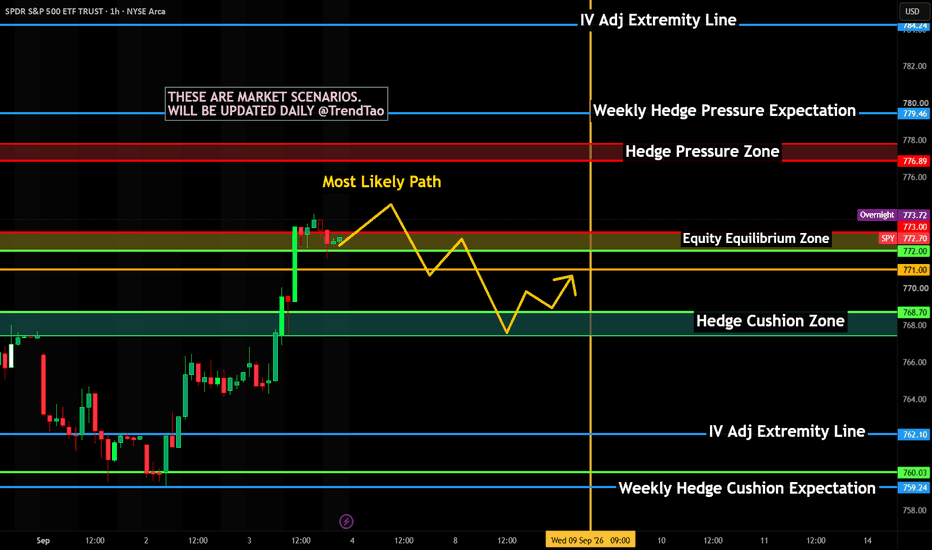
Long 
Gold Holds Key Support — Is the Recovery Ready to Continue?Market Structure
Gold remains within a broader bullish structure despite the recent corrective decline. After retreating from its recent highs, price has found buying interest near a key support zone and is attempting to stabilize. The latest rebound suggests buyers are returning, although stronger confirmation above nearby resistance is still required before the broader uptrend resumes.
Market Sentiment - Moderately Bullish
Short-term momentum has improved following the recent bounce from support, while the broader trend continues to favor buyers. Market sentiment remains cautiously optimistic as long as price holds above the recent demand zone.
Bullish Scenario
If buyers maintain control above the current support area and reclaim 4,500, bullish momentum could strengthen further. A sustained move above 4,560 would increase the probability of another advance toward the recent swing highs around 4,650.
Bearish Scenario
If sellers push price below 4,400, the current recovery may fail and expose the next support around 4,320. A decisive break beneath that level would increase the risk of a deeper corrective move.
────────────────────
Market Outlook
The recent rebound suggests that buying interest is returning after the previous correction. However, price still needs to overcome nearby resistance before confirming that the broader uptrend has resumed. Until then, the market remains in a recovery phase within a larger bullish structure.
────────────────────
Key Levels
First Resistance 4,500
Second Resistance 4,560
First Support 4,400
Second Support 4,320
────────────────────
Future Scenarios
A sustained move above 4,500 would indicate that buyers are regaining control and could drive price toward 4,560 before potentially retesting the recent highs near 4,650.
However, if price fails to hold above 4,400, selling pressure may return and extend the correction toward 4,320 before buyers attempt another recovery.
────────────────────
Event Risk
Gold remains highly sensitive to global macroeconomic developments and monetary policy expectations.
Traders continue to monitor Federal Reserve policy expectations, U.S. Treasury yields, inflation data, labor market reports, movements in the U.S. Dollar Index, and geopolitical developments. These factors remain the primary drivers of gold's short-term direction.
The next confirmed major macro event is the Federal Reserve meeting on September 15–16, 2026. Any change in interest-rate expectations could significantly influence gold through real yields, U.S. dollar movements, and overall market risk sentiment.
Ultimately, price reaction matters more than the headlines. If positive news cannot push gold above 4,500–4,560, upside momentum may remain limited. Conversely, if negative news fails to break 4,400–4,320, buyers may be preparing for another advance within the broader uptrend.
────────────────────
Please share your view below:
Do you expect gold to resume its primary uptrend from current support, or is a deeper correction becoming more likely?
More market structure and key level updates will be shared regularly. XAUUSD: Resistance Holds, Bearish Pressure Could ReturnXAUUSD remains under pressure on the H4 timeframe despite the recent recovery from the 4,300 area. Price is now approaching the key 4,490–4,520 resistance zone, where the rebound is beginning to lose momentum.
If price continues to stay below this resistance and selling pressure returns, I expect XAUUSD to move lower toward 4,425. A decisive break below this level could extend the decline toward 4,370.
The technical structure remains relatively bearish, as the current recovery is still trading beneath an important resistance area. Consequently, I favor a “sell on rally” strategy while the 4,490–4,520 zone remains intact.
Main Trend: Bearish | Resistance: 4,490–4,520 | Target: 4,370 Short 
NAS100: Trendline Breakdown & Liquidity Retest🔹 NAS100 is showing a corrective shift after facing strong rejection from the 29,700–29,800 resistance area. Price has moved below the rising trendline that supported the previous advance, suggesting that short-term market structure has weakened. The recent lower high and move toward 29,100 highlight increasing selling pressure, while the 28,250–28,400 region stands out as a visible liquidity and support area.
🔸 If the bearish structure remains intact, price could continue exploring lower levels toward the highlighted liquidity area, particularly if the 29,200–29,300 region continues to act as resistance. On the other hand, a strong reclaim above the broken structure could shift the short-term view back toward the resistance zone. Traders may wait for clear price confirmation before considering any trade, while a failure to hold the current area could expose deeper support levels.
This analysis is for educational purposes only and does not constitute financial or investment advice. Always conduct your own research before making trading decisions.  Short
Short
 Long
Long


